
What Is True Shooting Percentage?
True Shooting Percentage (TS%) is an advanced basketball statistic that measures a player's overall scoring efficiency. Unlike traditional field goal percentage, TS% accounts for two-point shots, three-point shots, and free throws together — giving a single number that reflects how efficiently a player turns shot attempts into points.

How to Use the Calculator
Enter three numbers from a game or season: total Points (PTS), Field Goal Attempts (FGA), and Free Throw Attempts (FTA). The calculator returns the player's TS% along with the True Shooting Attempts (TSA) used in the denominator. A TS% around 55% is solid, and elite scorers often exceed 60%.
The Formula Explained
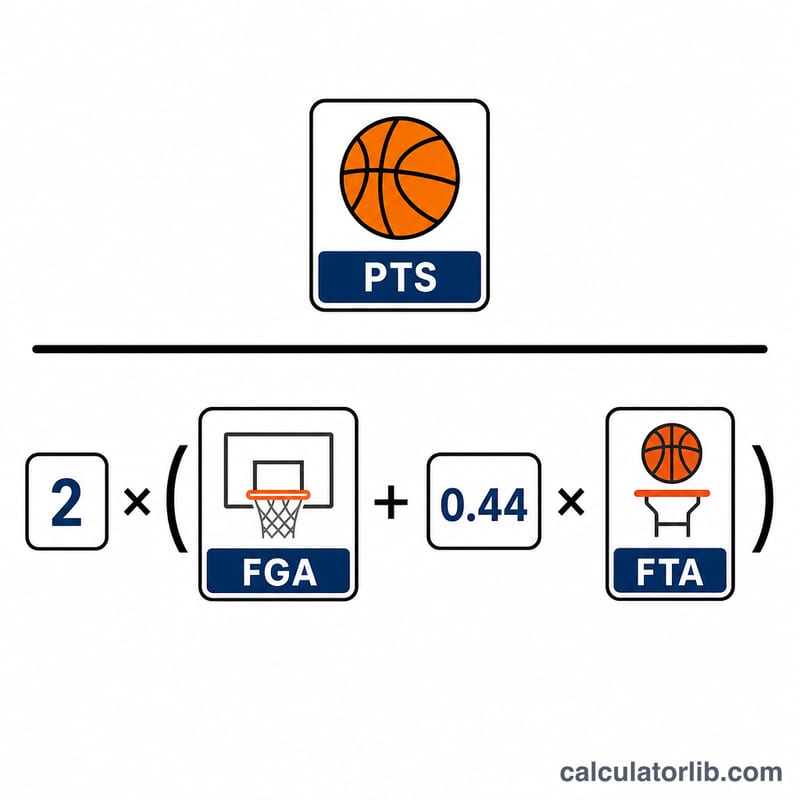
The formula is $$\text{TS\%} = \frac{\text{PTS}}{2 \times (\text{FGA} + 0.44 \times \text{FTA})} \times 100$$ The 0.44 coefficient is an estimate of how many "true" shooting possessions a free throw trip consumes, since not all free throws end a possession (and-ones, technicals, three-shot fouls). Multiplying the attempt base by 2 normalizes the result so that a perfectly efficient 2-point scorer would score near 100%.
Worked Example
Suppose a player scores 25 points on 18 field goal attempts and 6 free throw attempts. First compute $$\text{TSA} = 18 + 0.44 \times 6 = 18 + 2.64 = 20.64$$ The denominator is \(2 \times 20.64 = 41.28\). Then $$\text{TS\%} = \frac{25}{41.28} \times 100 \approx 60.56\%$$
TS% Benchmark Reference Table
True Shooting Percentage (TS%) combines field goals, three-pointers, and free throws into a single scoring-efficiency number, scaling for the fact that those shots are worth different amounts of points. The benchmark tiers below reflect the modern NBA scoring context, in which league-average TS% has hovered around 56–58% in recent seasons. Because the league average drifts over time, treat these bands as a guide rather than fixed thresholds.
| TS% Range | Tier | Notes |
|---|---|---|
| Below 50% | Poor / inefficient | Well below replacement level; usually only acceptable for very low-volume roles |
| 50% – 54% | Below average | Functional but a drag on offensive efficiency for a primary scorer |
| ~56% | League average | Roughly the modern NBA baseline (varies season to season) |
| 55% – 59% | Good / solid | Reliable, above-average scoring efficiency |
| 60% – 63% | Excellent | Top-tier efficiency, especially at meaningful volume |
| 64% and above | Elite | Among the most efficient scorers in the league; rare at high volume |
These bands assume a modern, three-point-heavy offensive environment. Era-adjusted comparisons should account for the lower league-wide TS% of earlier decades.
FAQ
Why is field goal percentage not enough? FG% ignores free throws and treats a three-pointer the same as a two-pointer. TS% captures the real value of every shot.
What is a good TS%? League average sits near 56%. Above 60% is excellent; below 50% is inefficient for a high-volume scorer.
Why 0.44 and not 0.5? 0.44 is the empirically derived rate that best estimates the number of possessions free throw attempts represent, because some free throws do not end a possession.