What Is a Win Rate?
Your win rate is the percentage of games you have won out of every game you have played. It is one of the most common performance metrics in esports, video games, board games, and traditional sports because it boils a long record down to a single, easy-to-compare number. A 60% win rate simply means you win 6 out of every 10 matches on average.
How to Use This Calculator
Enter the total number of games you have won and the total number of games you have played. The calculator instantly returns your win rate as a percentage, along with your number of losses for context. Make sure your games-played figure includes wins, losses, and any other completed games so the percentage reflects your full record.
The Formula Explained
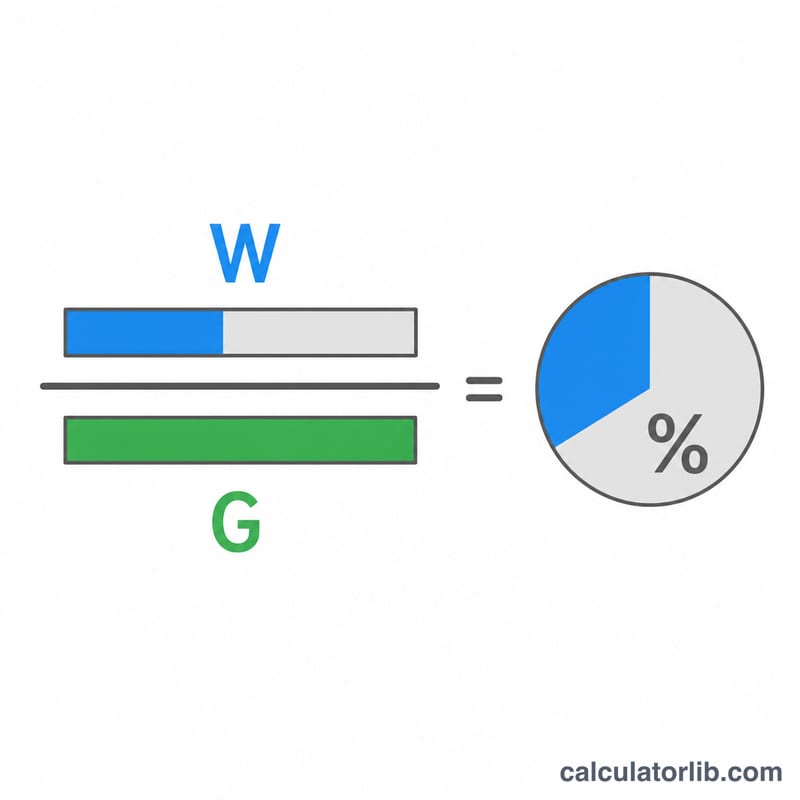
The math is a straightforward proportion:
$$\text{Win Rate} = \frac{\text{Wins}}{\text{Games Played}} \times 100\%$$
Dividing wins by total games gives a fraction between 0 and 1; multiplying by 100 converts it to a percentage. Losses are calculated as Games Played minus Wins.
Worked Example
Suppose you have played 50 ranked matches and won 27 of them. Your win rate is $$27 \div 50 = 0.54,$$ and \(0.54 \times 100 = \mathbf{54\%}\). You also have \(50 - 27 = 23\) losses. So your record reads 27–23 with a 54% win rate.
Win Rate Across Common Records
Win rate is the share of games played that ended in a win, expressed as a percentage:
$$\text{Win Rate} = \frac{\text{Wins}}{\text{Games Played}} \times 100\%$$The table below applies that formula to records that come up often in ranked ladders, tournament pools and casual season logs. Losses are shown as \(\text{Games Played} - \text{Wins}\), which assumes no draws are recorded. Percentages are rounded to one decimal place.
| Wins | Games Played | Losses | Win Rate (%) |
|---|---|---|---|
| 3 | 5 | 2 | 60.0% |
| 7 | 20 | 13 | 35.0% |
| 27 | 50 | 23 | 54.0% |
| 45 | 100 | 55 | 45.0% |
| 110 | 200 | 90 | 55.0% |
| 0 | 10 | 10 | 0.0% |
| 10 | 10 | 0 | 100.0% |
Worked example for the 27–23 row, with every value substituted:
$$\text{Win Rate} = \frac{27}{50} \times 100\% = 0.54 \times 100\% = 54.0\%$$Notice that 3/5 and 110/200 sit close together (60.0% and 55.0%) even though one record contains 5 games and the other 200. The percentage alone hides how much evidence stands behind it — a point developed in the next section.
Interpreting Your Win Rate
Why 50% is the reference point
In a skill-based rating system — Elo, Glicko or a proprietary MMR — the matchmaker's goal is to pair you with opponents of comparable rating. When it succeeds, each match is close to a coin flip, so your win rate is pushed toward 50%. That equilibrium is a property of the matchmaking, not of you: winning raises your rating, which raises the strength of your future opponents, which pulls your win rate back down. Sustaining a rate above 50% over many games therefore means the system has not yet placed you at your true level and you are still climbing; a rate persistently below 50% means the opposite. A rate sitting near 50% usually means you have settled at your current rating, not that you have stopped improving.
This logic applies only where matchmaking is rating-based and roughly symmetric. In an open bracket, a club ladder, a game with heavy team or faction imbalance, or matches against a fixed pool of opponents, 50% carries no special meaning and the raw percentage should be read against the field you actually faced.
Sample size and margin of error
A percentage from a small number of games is a noisy estimate. Using the standard error of a proportion, \(SE = \sqrt{p(1-p)/n}\), a 55% win rate behaves very differently at different sample sizes:
| Record | Win Rate | Approx. 95% interval |
|---|---|---|
| 11 of 20 | 55.0% | roughly 33% – 77% |
| 55 of 100 | 55.0% | roughly 45% – 65% |
| 275 of 500 | 55.0% | roughly 51% – 59% |
At 20 games the interval still comfortably contains 50%, so the record is consistent with an even player having a warm streak. At 500 games it does not, which is much stronger evidence of a genuine edge. The width of the interval shrinks in proportion to \(1/\sqrt{n}\): quadrupling the number of games only halves the uncertainty. Treat any win rate under about 30 games as an early indication rather than a measurement.
Draws change the denominator
If your game records draws, ties or unfinished matches, you must decide whether they belong in Games Played — and the choice moves the number. Take a record of 20 wins, 15 losses and 5 draws:
$$\text{Including draws} = \frac{20}{40} \times 100\% = 50.0\%$$$$\text{Decisive games only} = \frac{20}{35} \times 100\% \approx 57.1\%$$Both figures are correct; they answer different questions. Including draws tells you how often you win a game you sit down to play. Excluding them tells you how often you win when a game reaches a result — the convention often preferred in chess and other draw-heavy formats, where a points-based score (a draw counting as half a point) is used instead. Whichever you choose, state it, and use the same convention when comparing two players.
What win rate does not tell you
- Opponent strength is invisible. 60% against beginners and 60% against a national squad produce the same number.
- Role, character and mode are pooled. A single ladder-wide figure can hide a strong main and a weak secondary that average out to something unremarkable.
- Team games dilute individual contribution. In a five-player team, four teammates influence each result as much as you do.
- Streaks and dodges distort short logs. Quitting after a bad run or replaying only favourable matchups biases the sample.
Win rate is best read alongside sample size, the segment it covers (mode, role, season, patch) and outcome-quality measures such as rating change, score margin or points per game. It is a summary of results, not a direct measure of skill.
Key Terms Explained
- Win Rate
- Wins divided by games played, multiplied by 100 to give a percentage: \(\text{Win Rate} = (\text{Wins} \div \text{Games Played}) \times 100\%\). Always bounded between 0% and 100%.
- Wins
- The number of games that ended in a result credited to you. Only games that count toward the same record should be included — mixing ranked and unranked results makes the percentage hard to interpret.
- Games Played
- The total number of completed games in the record: wins plus losses plus any draws. Abandoned, cancelled or unstarted matches are normally excluded, since they have no outcome. This is the denominator of the formula, so it must never be zero.
- Losses
- Games that ended in defeat. When no draws are recorded, \(\text{Losses} = \text{Games Played} - \text{Wins}\).
- Draw / Tie
- A game that ends with neither side winning. Draws are part of games played but are not wins, so they lower the win rate when included in the denominator.
- Decisive Games
- Wins plus losses only, with draws removed. Used as an alternative denominator when you want to know how often you win a game that actually produces a winner.
- Sample Size
- The number of games behind the percentage (the \(n\) in the formula). Larger samples give narrower confidence intervals and a more trustworthy estimate of true performance.
- MMR / Elo
- Matchmaking Rating and Elo are numerical skill ratings that rise after wins and fall after losses. Elo, devised by Arpad Elo and adopted by FIDE for chess, is the original of the family; most modern games use a private variant referred to simply as MMR. These systems pair similarly rated players, which is why balanced matchmaking drives win rates toward 50%.
- Win–Loss Record
- Shorthand notation for the raw counts, written wins first: a 27–23 record means 27 wins and 23 losses over 50 games, or 54.0%. Where draws exist the record is often written with three numbers, such as 20–15–5.
- Loss Rate
- Losses divided by games played, as a percentage. When no draws are recorded it is simply \(100\% - \text{Win Rate}\); with draws in the denominator, win rate and loss rate no longer sum to 100%.
FAQ
What is a good win rate? It depends on the game and ranking system. In many competitive matchmaking systems, a sustained win rate above 50% means you are climbing, while elite players often sit around 55–60%.
Does the calculator count draws? Draws are not counted as wins, so include them in games played if you want them to affect the percentage. Excluding them gives a win rate among decisive games only.
How many games do I need for a reliable win rate? A larger sample is more stable. A 70% win rate over 10 games can easily swing, while the same rate over 200 games is far more meaningful.