What Is a Win Rate Calculator?
A win rate calculator tells you what percentage of your games, matches or attempts ended in a win. It is widely used in gaming and esports (e.g. ranked ladders, MOBAs, shooters), traditional sports, trading, and any situation where outcomes are split into wins and losses. Knowing your win rate gives you a single, comparable number to track improvement over time.
How to Use It
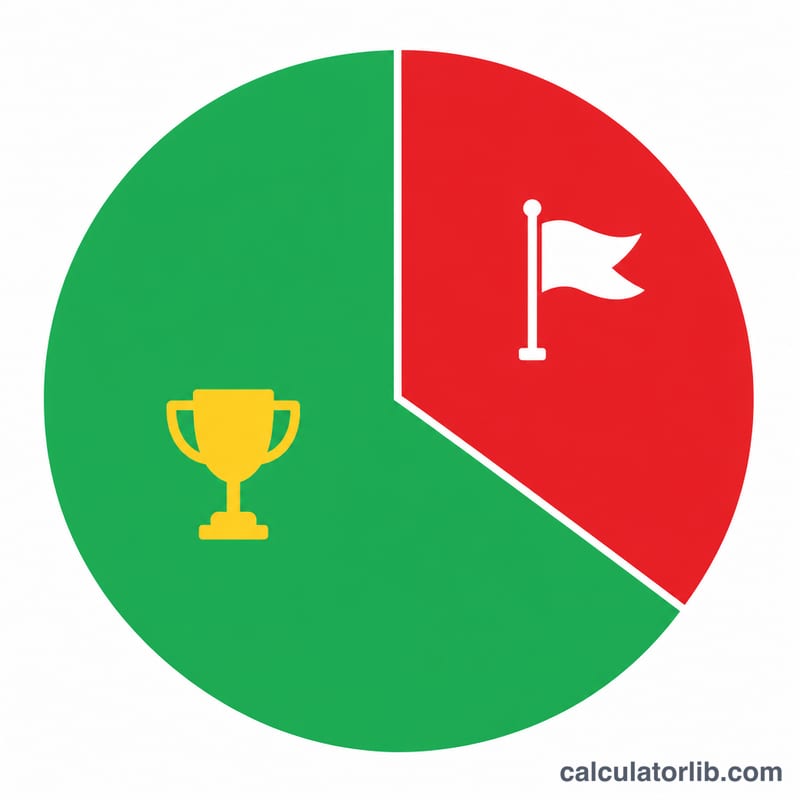
Enter the number of games you won and the number you lost, then read the result. The calculator returns your win rate as a percentage, your loss rate, and the total number of games counted. Only completed wins and losses should be included — leave out draws or unfinished games unless you want them counted as losses.
The Formula Explained
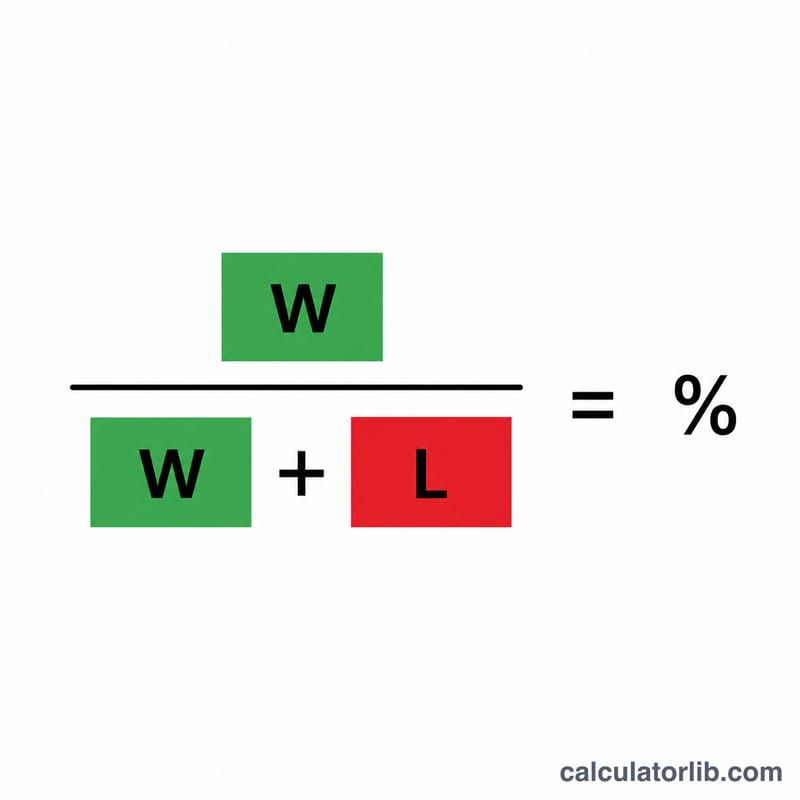
The win rate is simply the share of total games that were wins:
$$\text{Win Rate} = \frac{\text{Wins}}{\text{Wins} + \text{Losses}} \times 100$$
The denominator is the total games played. Multiplying by 100 converts the fraction into a percentage. The loss rate is the complement, so win rate plus loss rate always equals 100% when only wins and losses are counted.
Worked Example
Suppose you won 27 ranked matches and lost 13. Total games = \(27 + 13 = 40\). Win rate = $$27 \div 40 \times 100 = 67.5\%$$ Your loss rate is $$13 \div 40 \times 100 = 32.5\%$$ A win rate above 50% means you win more often than you lose.
Interpreting Your Win Rate
A win rate is simply the share of decided games you have won: \( \text{Win Rate} = \dfrac{W}{W + L} \times 100\% \). The bands are easy to read once you know what the denominator is doing.
- Exactly 50% — break-even. You have won as many games as you have lost. Most competitive matchmaking systems (Elo, Glicko, and the MMR variants built on them) pair players of similar estimated strength, so a player who is correctly rated tends to converge toward roughly 50% over a long run. A 50% win rate therefore usually means "the system currently rates me about right," not "I am not improving."
- Above 50% — net climbing. Over the sample you measured, wins outnumber losses, so rating or standing moves upward.
- Below 50% — net dropping. Losses outnumber wins over that sample.
What the number does not contain. Win rate is a ratio of counts and carries no information about who you played. Two players with identical 55% rates may be facing completely different opposition. In Elo/MMR-style ladders the rating you gain per game depends on the rating difference between you and your opponent: beating a higher-rated opponent awards more points than beating a lower-rated one, and losing to a lower-rated opponent costs more. As a result a 55% win rate earned against consistently stronger opponents can produce more rating gain than a 60% win rate farmed against weaker ones. Win rate also says nothing about rank inflation or deflation in the player pool, nor about smurfing, queue dodging, or unranked/casual games mixed into the same count.
Sample size and margin of error. Treating each game as an independent win/loss trial, the standard error of an observed win rate \(p\) over \(n\) games is
$$ SE = \sqrt{ \frac{p(1-p)}{n} } $$At \(p = 0.50\) and \(n = 25\): \( SE = \sqrt{0.25/25} = \sqrt{0.01} = 0.10 \), i.e. about ±10 percentage points for one standard error — a 60% rate over 25 games is statistically ordinary for a 50% player. At \(n = 100\): \( SE = \sqrt{0.25/100} = 0.05 \), about ±5 points. At \(n = 400\): \( SE = \sqrt{0.25/400} = 0.025 \), about ±2.5 points (roughly ±3). Precision improves with the square root of the number of games, so quadrupling your sample halves the uncertainty. A conventional 95% interval is roughly ±2 standard errors, which at 25 games spans about ±20 points.
This formula assumes games are independent and drawn from a stable skill level; long sessions, patch changes, and streak-based matchmaking all violate that assumption to some degree, so treat the figure as a rough scale for how much noise is in your number rather than an exact confidence statement.
Win Rate Across Common Scenarios
Each row below is computed with \( \dfrac{W}{W+L} \times 100\% \); the loss rate is the complement, \( 100\% - \text{Win Rate} \).
| Wins | Losses | Total Games | Win Rate % | Loss Rate % | Note |
|---|---|---|---|---|---|
| 5 | 5 | 10 | 50.0% | 50.0% | Break-even, but 10 games carries roughly ±16 points of standard error — essentially no information about true skill. |
| 6 | 4 | 10 | 60.0% | 40.0% | One extra win over 5/5. Same percentage as 60/40 below, vastly less reliable. |
| 60 | 40 | 100 | 60.0% | 40.0% | Identical percentage to 6/4, but with ~±4.9 points of standard error instead of ~±15.5 — this one is a real signal. |
| 27 | 13 | 40 | 67.5% | 32.5% | A strong 40-game run; in sports notation this is a 27-13 record, or .675. |
| 52 | 48 | 100 | 52.0% | 48.0% | A typical steady-climb rate: only 4 games net positive, yet enough to move rating upward over time. |
| 104 | 96 | 200 | 52.0% | 48.0% | Same 52.0% over double the games; standard error drops from ~±5.0 to ~±3.5 points. |
| 45 | 55 | 100 | 45.0% | 55.0% | Net dropping — 10 games underwater over 100. |
| 500 | 500 | 1000 | 50.0% | 50.0% | Break-even at large sample; standard error ~±1.6 points, so this is a genuine 50% player rather than noise. |
Reliability, not just the percentage. Compare the 6/4 and 60/40 rows: both read 60.0%, and a calculator cannot tell them apart. But 6/4 is four coin flips away from 2/8, while 60/40 would require an implausible run of luck to be produced by a true 50% player. Whenever you compare two win rates, compare their total-games columns first.
Key Terms Explained
- Win Rate
- The percentage of decided games you won: wins divided by wins plus losses, multiplied by 100.
- Loss Rate
- The complement of the win rate — losses divided by total games. When there are no draws, win rate and loss rate always sum to 100%.
- Total Games (denominator)
- The number of games counted in the ratio, \(W + L\). What you include or exclude here (unranked games, remakes, abandoned matches) changes the result, so keep the definition consistent across comparisons.
- Draw / Tie and the half-win convention
- A game that ends without a winner. The common convention — used in chess and in many league tables — is to count a draw as half a win, giving \( \text{Win Rate} = \dfrac{W + 0.5D}{W + L + D} \times 100\% \). The alternative is to exclude draws from the denominator entirely; state which method you used, because the two give different numbers.
- Win-Loss Record
- The raw counts written as a pair, e.g. "27-13" meaning 27 wins and 13 losses. It preserves the sample size that a lone percentage throws away.
- Sample Size
- The number of games behind the percentage. It governs how much random variation is in the figure — uncertainty shrinks with \( \sqrt{n} \), so 400 games is twice as precise as 100.
- Winning Percentage
- The North American sports convention of expressing the same ratio as a three-decimal number without a percent sign: a 27-13 record is ".675", read as "six seventy-five". It is the same quantity as a 67.5% win rate.
- MMR / Elo
- Matchmaking Rating and the Elo rating system it descends from: numeric estimates of player strength that rise and fall after each game by an amount depending on the rating gap between the players. Elo was devised for chess by Arpad Elo and adopted by FIDE in 1970; game-specific MMR systems (and relatives such as Glicko and TrueSkill) vary in their exact formulas.
- Win Streak
- A run of consecutive wins with no loss in between. Streaks are a normal product of randomness — even a 50% player will hit long runs given enough games — and some systems grant bonus rating for them.
- Break-Even Rate
- The win rate at which wins and losses cancel out — 50% in a plain win/loss count. In systems with uneven point gains or entry fees, the break-even rate can sit above or below 50%.
Which formula do you need?
Three related measures are in common use, and they answer different questions. Pick one and keep it fixed when you compare periods.
- Win rate, \(\frac{W}{W+L}\times 100\%\): the share of decided games you won. This is what the calculator returns. It is bounded between 0% and 100%, so it is easy to compare across players.
- Win/loss ratio, \(\frac{W}{L}\): wins per loss. It is unbounded and undefined when losses are 0. The two are linked by \(\text{rate} = \frac{r}{1+r}\), where \(r\) is the ratio. For 3 wins and 1 loss, \(r = 3\) and \(\frac{3}{1+3} = 0.75\), which is 75%.
- Win rate including draws, \(\frac{W}{W+L+D}\times 100\%\): use this when a draw is a genuine third outcome. It is always lower than or equal to the win rate that ignores draws.
Draws change the answer. Take 20 wins, 10 losses and 10 draws. Ignoring draws gives \(\frac{20}{20+10} = 66.7\%\). Counting draws gives \(\frac{20}{20+10+10} = 50\%\). To get the second figure here, enter the draws as losses, as the calculator only takes wins and losses. State which convention you used, because the same record produces both numbers.
Sample size matters too. 3 wins out of 4 games is 75%, but with so few games a handful of results can change it a lot. A win rate becomes more meaningful as the count of games grows, so compare rates over similar numbers of games. With 0 games played the rate is undefined, not 0%, and the calculator asks for at least one result.
Conventions and edge cases
Each case below was run through this calculator; the result column is what it actually returns.
| Case | Input | Result |
|---|---|---|
| 3 wins, 1 loss | 3, 1 | 75% |
| No games played | 0, 0 | No games played yet: enter at least one win or loss. |
Checked on 2026-11-08
FAQ
What is a good win rate? Anything above 50% means you win more than half your games. In competitive ranked systems, sustained win rates of 52–55% are usually enough to climb over time.
Do draws count? This calculator only uses wins and losses. If you have draws, decide whether to ignore them or treat them as half-wins/half-losses before entering your numbers.
How many games do I need for an accurate rate? Small samples are noisy. A few hundred games gives a far more reliable win rate than ten or twenty.