What this calculator does
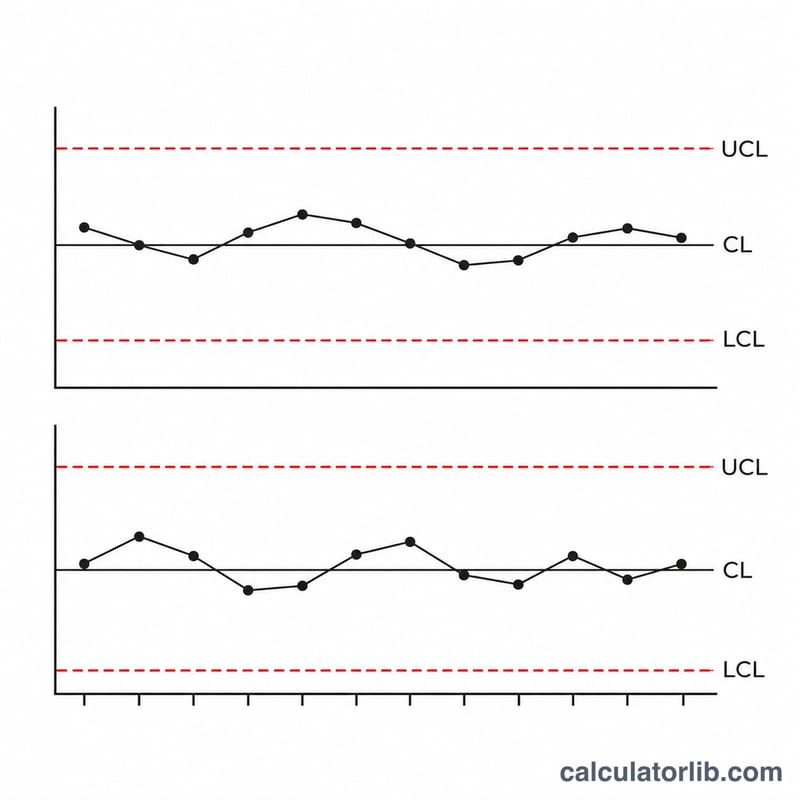
This calculator computes the center lines and 3-sigma control limits for a Shewhart X-bar chart (subgroup averages) and an R chart (subgroup ranges). It suits quality engineers, process technicians and students who monitor a measured characteristic in rational subgroups of equal size. You can enter the grand mean and average range directly, or paste lists of subgroup means and ranges.
How to use it
First choose the input mode. In summary mode, enter the grand mean and the average range (R-bar, zero or greater). In data mode, enter the subgroup means and the subgroup ranges as numbers separated by semicolons or spaces, with a period as the decimal separator; both lists must have the same count. Then select the subgroup size n, from 2 to 10. Only the fields of the chosen mode are used.
Formula
For the X-bar chart:
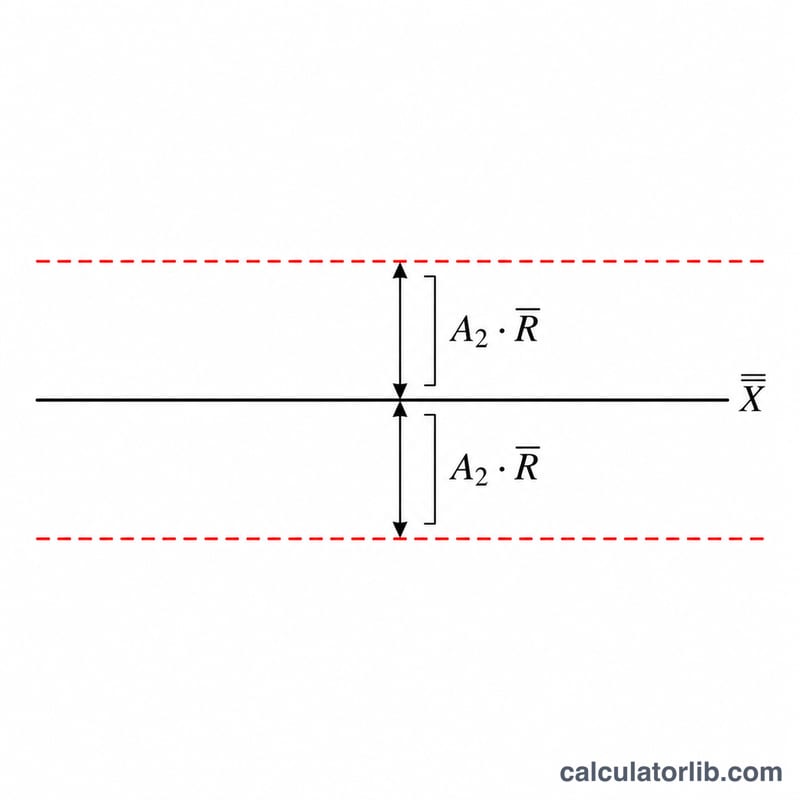
$$UCL=\bar{\bar{x}}+A_2\bar{R},\quad CL=\bar{\bar{x}},\quad LCL=\bar{\bar{x}}-A_2\bar{R}$$
For the R chart:
$$UCL=D_4\bar{R},\quad CL=\bar{R},\quad LCL=D_3\bar{R}$$
In data mode: $$\bar{R}=\frac{R_1+\dots+R_k}{k},\quad \bar{\bar{x}}=\frac{\bar{x}_1+\dots+\bar{x}_k}{k}$$
Here \(\bar{\bar{x}}\) is the grand mean, \(\bar{R}\) the average range, \(k\) the number of subgroups, and \(A_2\), \(D_3\), \(D_4\) are tabulated factors that depend on \(n\). They derive from \(A_2 = 3/(d_2\sqrt{n})\), \(D_3 = 1-3d_3/d_2\) and \(D_4 = 1+3d_3/d_2\).
Conventions and assumptions
- Limits are the customary 3-sigma limits given in the NIST/SEMATECH e-Handbook.
- The A2, D3 and D4 values are used exactly as printed in the handbook table (3 decimals) for n = 2 to 10, not recomputed.
- Only n = 2 to 10 is supported; for larger subgroups the handbook recommends an s chart.
- In data mode the grand mean is the mean of the subgroup means and R-bar is the mean of the ranges. Equal subgroup sizes are assumed.
- The R chart LCL is D3 times R-bar, which is 0 for n of 6 or less. The X-bar LCL is not clamped and may be negative.
- Results are raw values shown to 4 decimal places; this is a display choice only.
Worked example
Summary mode, \(n=5\), grand mean 10, \(\bar{R}=0.5\). The factors are \(A_2=0.577\), \(D_3=0\), \(D_4=2.115\).
$$UCL_{\bar{x}}=10+0.577\times 0.5=10.2885$$
$$CL_{\bar{x}}=10$$
$$LCL_{\bar{x}}=10-0.577\times 0.5=9.7115$$
$$UCL_R=2.115\times 0.5=1.0575,\quad CL_R=0.5,\quad LCL_R=0\times 0.5=0$$
The number of subgroups is reported as 0 because summary mode was used.
How to read the result
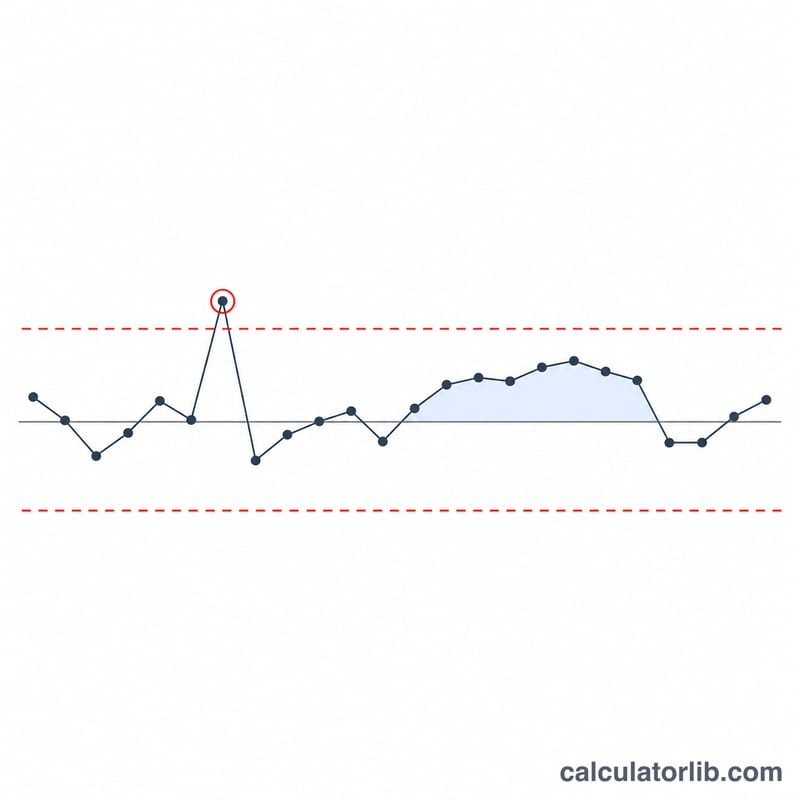
Plot subgroup means against the X-bar limits and subgroup ranges against the R limits. Points outside the limits suggest a special cause. Review the R chart first, since the X-bar limits are only meaningful when within-subgroup variation is stable. Limits estimated from few subgroups are unreliable, and a single subgroup (k = 1) is accepted but gives weak estimates. If R-bar is 0, all limits equal their center lines. The calculator assumes roughly normal data and equal subgroup sizes.
FAQ
Why is the R chart lower limit 0?
For n of 6 or less, D3 is 0, so the lower limit is 0.
Can the X-bar LCL be negative?
Yes. It is not truncated, so it can fall below zero when the mean is small relative to A2 times R-bar.
Why is n limited to 10?
The handbook tabulates factors up to n = 10 and recommends an s chart for larger subgroups.
Which mode should I use?
Use summary mode if you already know the grand mean and R-bar. Use data mode to compute them from subgroup means and ranges.
Are the limits the same as specification limits?
No. Control limits describe process behavior; specification limits describe customer requirements.
Sources
- 6.3.2.1. Shewhart X-bar and R and S Control Charts, NIST/SEMATECH e-Handbook of Statistical Methods, NIST Information Technology Laboratory