What is the Adrenal Washout Calculator?
This tool computes the absolute percentage washout (APW) and relative percentage washout (RPW) of an adrenal lesion on multiphase CT. Contrast washout is a key imaging feature used to distinguish benign lipid-poor adenomas, which enhance and de-enhance rapidly, from non-adenomas such as metastases and pheochromocytomas, which tend to retain contrast on delayed imaging.
How to use it
Enter three attenuation values in Hounsfield units (HU) measured from a region of interest placed over the lesion: the unenhanced value, the enhanced (portal venous, typically 60–70 second) value, and the delayed (usually 15-minute) value. The calculator returns both APW and RPW. APW requires all three phases; RPW can be reported even when no unenhanced scan was performed.
The formula explained
$$\text{APW} = \frac{E - D}{E - U} \times 100$$ The numerator measures how much contrast has washed out between the enhanced and delayed phases, and the denominator normalizes by the total contrast that was actually taken up (enhanced minus baseline). $$\text{RPW} = \frac{E - D}{E} \times 100$$ uses the enhanced value as the denominator. Common diagnostic thresholds: APW ≥ 60% and RPW ≥ 40% favor a benign adenoma.
Worked example
Suppose Unenhanced = 10 HU, Enhanced = 80 HU, Delayed = 40 HU. $$\text{APW} = \frac{80 - 40}{80 - 10} \times 100 = \frac{40}{70} \times 100 \approx 57.14\%$$ $$\text{RPW} = \frac{80 - 40}{80} \times 100 = 50\%$$ Here APW is just below the 60% adenoma threshold while RPW exceeds 40%, illustrating why results should be interpreted with clinical context.
Interpreting Your APW and RPW Results
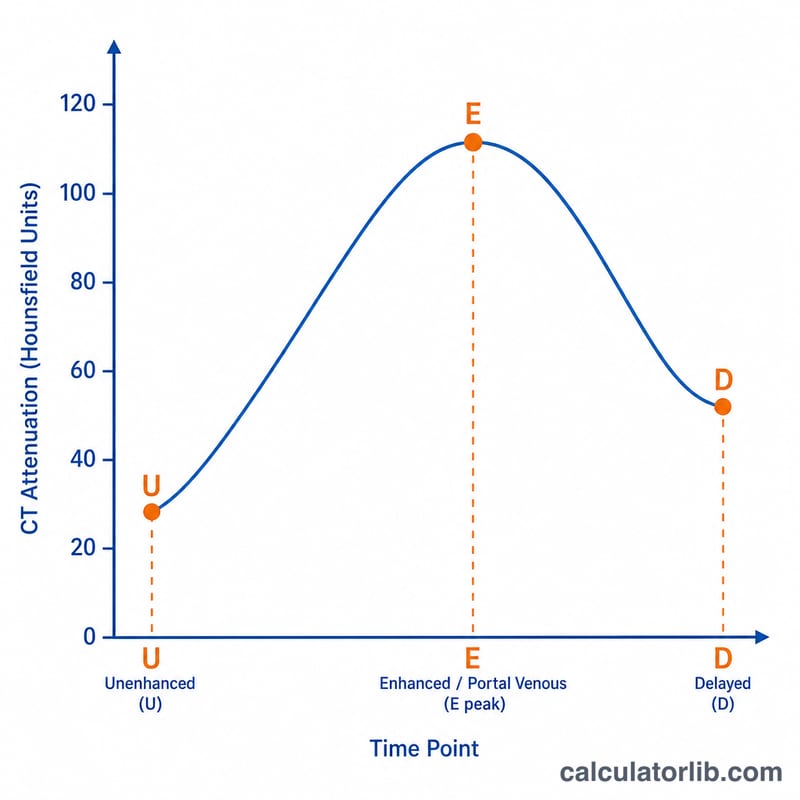
Adrenal washout characterizes an adrenal nodule by how quickly it loses ("washes out") iodinated contrast between the enhanced and delayed CT phases. Adenomas — even those that are not lipid-rich — tend to enhance briskly and then release contrast rapidly, whereas most metastases, pheochromocytomas, and adrenocortical carcinomas retain contrast longer.
The two standard metrics are:
- Absolute percentage washout (APW), which requires an unenhanced scan: \(\text{APW} = \dfrac{\text{Enhanced} - \text{Delayed}}{\text{Enhanced} - \text{Unenhanced}} \times 100\%\)
- Relative percentage washout (RPW), used when no unenhanced phase is available: \(\text{RPW} = \dfrac{\text{Enhanced} - \text{Delayed}}{\text{Enhanced}} \times 100\%\)
Commonly cited diagnostic thresholds for a benign lipid-poor adenoma are:
| Metric | Threshold for adenoma | Interpretation |
|---|---|---|
| APW | ≥ 60% | Consistent with adenoma (rapid washout) |
| RPW | ≥ 40% | Consistent with adenoma (rapid washout) |
| APW | < 60% | Indeterminate / suspicious for non-adenoma |
| RPW | < 40% | Indeterminate / suspicious for non-adenoma |
For example, an enhanced value of 80 HU, a delayed value of 30 HU, and an unenhanced value of 20 HU gives an APW of 83.3%, comfortably above 60% and therefore consistent with an adenoma.
Non-adenomas. Metastases (e.g., from lung or renal cell carcinoma) and pheochromocytomas typically retain contrast on the delayed phase, producing low washout values (APW < 60%, RPW < 40%). Importantly, pheochromocytomas and hypervascular metastases can occasionally show high washout, so a high APW/RPW does not completely exclude these lesions.
Role of the unenhanced HU. Washout calculations are most useful for lesions that are not already diagnosable on the unenhanced scan. A homogeneous nodule measuring ≤ 10 HU on unenhanced CT is, by itself, diagnostic of a lipid-rich adenoma, and washout analysis is generally unnecessary. Washout is reserved for nodules with unenhanced attenuation > 10 HU (lipid-poor lesions).
Caveats. There is measurable overlap between adenomas and non-adenomas, and reported thresholds depend on the exact delayed-phase timing (often ~15 minutes), the contrast protocol, and ROI placement. Values near the cutoff should be interpreted with caution and in the clinical context. Heterogeneous, large, necrotic, or rapidly growing lesions, or any lesion in a patient with a known primary malignancy, may warrant further imaging, biopsy, or follow-up regardless of washout numbers. This tool provides general educational information and is not a substitute for professional medical evaluation or radiologic interpretation.
Key Terms and Variables
- Hounsfield Unit (HU)
- The standardized scale of CT attenuation (radiodensity). By definition water is 0 HU and air is −1000 HU. Adrenal attenuation values on each CT phase are reported in HU.
- Unenhanced / non-contrast phase (U)
- The baseline CT acquired before intravenous contrast. The unenhanced attenuation determines whether a nodule is lipid-rich (≤ 10 HU, diagnostic of adenoma) and is the denominator term in the APW formula.
- Enhanced / portal venous phase (E)
- CT acquired after intravenous contrast, typically at about 60–70 seconds. This is the peak/contrast-enhanced attenuation used as the starting point for washout.
- Delayed phase (D)
- CT acquired after a delay, conventionally about 15 minutes after contrast injection, to measure how much contrast the lesion has retained or released.
- Absolute percentage washout (APW)
- The fraction of enhancement lost between the enhanced and delayed phases relative to net enhancement above baseline: \(\text{APW} = \dfrac{E - D}{E - U} \times 100\%\). Requires an unenhanced phase.
- Relative percentage washout (RPW)
- The fraction of enhanced attenuation lost on the delayed phase when no unenhanced scan is available: \(\text{RPW} = \dfrac{E - D}{E} \times 100\%\).
- Region of interest (ROI)
- The user-drawn area on the image over which the average HU is measured. Consistent ROI placement (avoiding edges, calcification, necrosis, and adjacent fat) across all phases is essential for reliable washout values.
- Lipid-rich adenoma
- A benign adrenal adenoma with abundant intracytoplasmic fat, giving low unenhanced attenuation (≤ 10 HU); usually diagnosable without washout analysis.
- Lipid-poor adenoma
- A benign adenoma with little intracytoplasmic fat, so unenhanced attenuation is > 10 HU; these are the lesions for which washout (APW ≥ 60% or RPW ≥ 40%) is most useful.
FAQ
When should I use RPW instead of APW? Use RPW when no non-contrast (unenhanced) scan is available, since APW cannot be computed without a baseline.
What thresholds indicate an adenoma? APW ≥ 60% or RPW ≥ 40% is commonly used to suggest a benign adenoma, though thresholds vary by protocol.
Is this a diagnosis? No. This calculator is an educational aid; imaging interpretation should always be performed by a qualified radiologist within the full clinical picture.