
What This Calculator Does
The Salary to Hourly Wage Calculator converts a fixed annual salary into the equivalent hourly rate of pay. This is useful when comparing a salaried job offer to an hourly position, budgeting your time, negotiating freelance rates, or simply understanding what each hour of your work is really worth. It also breaks your pay down into daily, weekly, and monthly figures.
How to Use It
Enter three values: your gross annual salary (before tax), the number of hours you typically work each week, and the number of paid weeks in your year. Most full-time workers use 40 hours per week and 52 weeks per year. If you take unpaid leave, reduce the weeks accordingly. Press calculate to see your hourly wage along with daily, weekly, and monthly equivalents.
The Formula Explained
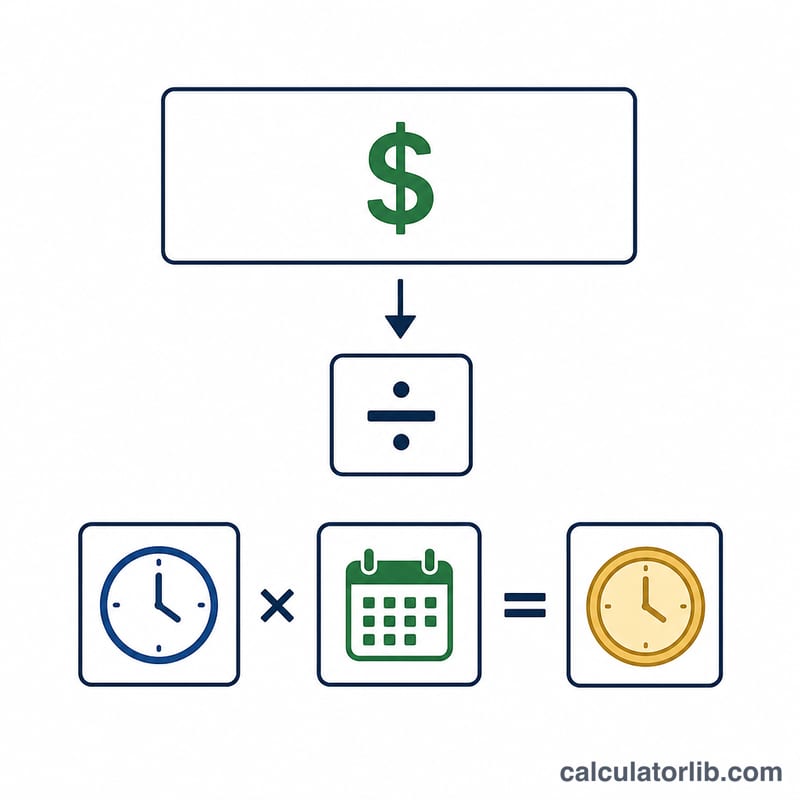
The core calculation is simple: $$\text{Hourly Rate} = \frac{\text{Annual Salary}}{\text{Hours/Week} \times \text{Weeks/Year}}$$ The denominator gives the total number of hours you work in a year. Dividing your salary by those hours yields the value of each hour. Weekly pay is the salary divided by weeks worked, and monthly pay divides the annual salary by 12.
Worked Example
Suppose you earn $52,000 per year, work 40 hours per week, and are paid for all 52 weeks. Total hours = \(40 \times 52 = 2{,}080\). Hourly rate = $$\frac{52{,}000}{2{,}080} = \$25.00 \text{ per hour}$$ Your weekly pay is \(52{,}000 \div 52 = \$1{,}000\), daily pay (5-day week) is $200, and monthly pay is \(52{,}000 \div 12 \approx \$4{,}333.33\).

Hourly Rate Across Common Salary Scenarios
The same annual salary produces very different hourly rates depending on how many hours you actually work each week. The table below assumes a full 52 paid weeks per year and applies the formula \(\text{Hourly Rate} = \frac{\text{Annual Salary}}{\text{Hours/Week} \times \text{Weeks/Year}}\). Weekly pay is simply the annual salary divided by 52, and monthly pay is the annual salary divided by 12 — these do not change with hours worked, but the hourly rate does.
| Annual Salary | Hours/Week | Hourly Rate | Weekly Pay | Monthly Pay |
|---|---|---|---|---|
| $40,000 | 35 | $21.98 | $769.23 | $3,333.33 |
| $40,000 | 40 | $19.23 | $769.23 | $3,333.33 |
| $40,000 | 45 | $17.09 | $769.23 | $3,333.33 |
| $52,000 | 35 | $28.57 | $1,000.00 | $4,333.33 |
| $52,000 | 40 | $25.00 | $1,000.00 | $4,333.33 |
| $52,000 | 45 | $22.22 | $1,000.00 | $4,333.33 |
| $75,000 | 35 | $41.21 | $1,442.31 | $6,250.00 |
| $75,000 | 40 | $36.06 | $1,442.31 | $6,250.00 |
| $75,000 | 45 | $32.05 | $1,442.31 | $6,250.00 |
| $100,000 | 35 | $54.95 | $1,923.08 | $8,333.33 |
| $100,000 | 40 | $48.08 | $1,923.08 | $8,333.33 |
| $100,000 | 45 | $42.74 | $1,923.08 | $8,333.33 |
Notice how a $100,000 salary worked at 45 hours per week ($42.74/hr) yields a lower hourly rate than a $75,000 salary worked at 35 hours per week ($41.21/hr). If you want to work backward instead — turning an hourly rate into a yearly figure — use an hourly to annual salary calculator.
Common Annual-to-Hourly Reference Values
These figures assume a standard full-time schedule of 40 hours per week across all 52 weeks of the year, for a total of 2,080 paid hours. This 2,080-hour basis is the most widely used convention for converting a salary to an hourly rate, so it makes a clean reference point. Each rate equals the annual salary divided by 2,080.
| Annual Salary | Hours/Year | Hourly Rate (40 hrs/wk, 52 wks) |
|---|---|---|
| $30,000 | 2,080 | $14.42 |
| $40,000 | 2,080 | $19.23 |
| $50,000 | 2,080 | $24.04 |
| $60,000 | 2,080 | $28.85 |
| $75,000 | 2,080 | $36.06 |
| $100,000 | 2,080 | $48.08 |
| $150,000 | 2,080 | $72.12 |
If your employer gives paid vacation, the 2,080-hour figure still works because you are paid for those weeks. If instead you only want to count weeks you actually work (for example, 48 weeks of unpaid time off), lower the weeks-per-year value and your effective hourly rate will rise.
Key Terms Explained
- Gross annual salary
- Your total yearly pay before any deductions for taxes, retirement contributions, or insurance. This is the figure used as the numerator in the hourly conversion. Your take-home (net) pay is lower — estimate it with a take-home paycheck calculator.
- Hourly rate
- The amount earned for one hour of work, found by dividing gross annual salary by total paid hours in the year. At 40 hours per week for 52 weeks, that is 2,080 hours.
- Paid weeks
- The number of weeks per year for which you receive pay. Salaried employees with paid time off are typically paid for all 52 weeks; contractors or seasonal workers may use fewer, which raises the effective hourly rate.
- Hours per week
- Your scheduled or actual weekly working hours. Full-time is usually 35–40 hours; using your real hours (including unpaid overtime) gives a more honest hourly figure.
- Blended rate
- A single average hourly rate that combines time worked at different pay rates — for instance regular and overtime hours, or two jobs — into one weighted figure. For overtime-specific math, see a overtime pay calculator.
- FTE (full-time equivalent / 2,080 hours)
- A standard unit representing one full-time employee's annual hours: 40 hours per week × 52 weeks = 2,080 hours. Employers use FTE to compare part-time and full-time staffing and to set salary-to-hourly benchmarks.
Income and jobs: United States
Average income and unemployment in United States compared with the world, from the World Bank: a benchmark for the figures you enter above.
- GNI per capita 2025
- 88,810 USD
- GDP per capita, PPP 2025
- 90,027 intl. $
- World: 25,704
- Unemployment 2025
- 4.2%
- World: 4.8%
Latest change Up +7.1% 2025: 88,810 USD, against 82,910 USD in 2024. CalculatorLib computes this change from the two published figures.
In 2025, gross national income per person in United States was 88,810 US dollars a year, about 7,401 US dollars a month. World: 14,244 USD
| Year | GNI per capita (USD) | GDP per capita, PPP (intl. $) | Unemployment |
|---|---|---|---|
| 2025 | 88,810 | 90,027 | 4.2% |
| 2024 | 82,910 | 86,170 | 4.0% |
| 2023 | 79,950 | 82,587 | 3.6% |
| 2022 | 77,230 | 78,009 | 3.7% |
| 2021 | 71,510 | 71,441 | 5.3% |
| 2020 | 64,630 | 64,465 | 8.1% |
| 2019 | 65,840 | 65,228 | 3.7% |
| 2018 | 63,040 | 62,876 | 3.9% |
| 2017 | 58,860 | 60,048 | 4.4% |
| 2016 | 56,830 | 57,977 | 4.9% |
GNI per capita (Atlas method) is the average of all income in the economy, not a typical salary; PPP dollars adjust for local prices.
Income tax and social security: United States
- Top income tax rate 2025
- 43.65%
- from 8.7 × the average wage
- Employee social security 2025
- 7.65% · 1.45%
In 2025, the top statutory personal income tax rate in United States (central and local government combined) was 43.65%. It applies from 8.7 times the average wage of 73,520 USD, that is from about 642,101 USD a year.
Employee social security contribution rates for successive earnings bands, lowest band first; the band limits are not shown.
Top income tax rates in OECD countries
| Country | Top rate | Applies from (× average wage) | Year |
|---|---|---|---|
| Japan | 55.95% | 7.7 | 2025 |
| France | 55.37% | 12.9 | 2025 |
| South Korea | 49.5% | 19.0 | 2025 |
| Germany | 47.48% | 4.4 | 2025 |
| United Kingdom | 45% | 2.2 | 2025 |
| United States | 43.65% | 8.7 | 2025 |
| Türkiye | 40.76% | 5.6 | 2025 |
| Mexico | 35% | 20.6 | 2025 |
The top rate is the statutory rate on the highest earnings, not the rate most workers pay. OECD figures cover OECD member countries only.
United States and other countries
GNI per capita in current US dollars (Atlas method) — each country’s latest published year.
- United States 88,810 USD (2025)
- France 48,630 USD (2025)
- Japan 38,340 USD (2025)
- South Korea 37,880 USD (2025)
- Saudi Arabia 36,070 USD (2025)
- Türkiye 16,300 USD (2025)
- Russia 15,960 USD (2025)
- World 14,244 USD (2025)
- China 14,230 USD (2025)
- Mexico 13,730 USD (2025)
- Vietnam 4,970 USD (2025)
- India 2,760 USD (2025)
No published figure yet for Taiwan.
Years can differ between rows: each figure is shown with its own year. The same World Bank indicator for every country.
Latest figure: 2025 Data last updated 2026-10-18 · current
Source: The World Bank Group CC BY 4.0; OECD, Tax Database CC BY 4.0
Monthly figures are computed by CalculatorLib from these data. The top-rate threshold in national currency (multiple × average wage) is computed by CalculatorLib from these data.
Source details and methodology
- The World Bank Group — World Development Indicators (NY.GNP.PCAP.CD, NY.GDP.PCAP.PP.CD, SL.UEM.TOTL.ZS)
- OECD, Tax Database — Top statutory personal income tax rate; employee social security contribution rates
FAQ
Is this before or after tax? The result is based on your gross salary, so the hourly figure is also pre-tax. Your take-home rate will be lower after deductions.
Why use 52 weeks? There are 52 weeks in a year. If you have unpaid time off, lower the weeks value to reflect actual paid working time.
Does this account for overtime or bonuses? No. It assumes a steady salary spread evenly across your stated hours. Add bonuses to your annual figure for a rough blended rate.