
What Is the Hourly Wage Calculator?
This tool converts any total amount of pay into an hourly rate by dividing it by the number of hours worked. Whether you are paid a flat project fee, a weekly salary, or just want to know what your time is really worth, the hourly wage calculator gives you a clear per-hour figure plus handy daily, weekly, and annual equivalents.
How to Use It
Enter the total pay you received and the total hours you worked to earn it. Click calculate. The result shows your hourly wage along with what that rate works out to per 8-hour day, per 40-hour week, and per year (52 weeks). Make sure both numbers cover the same period for an accurate result.
The Formula Explained
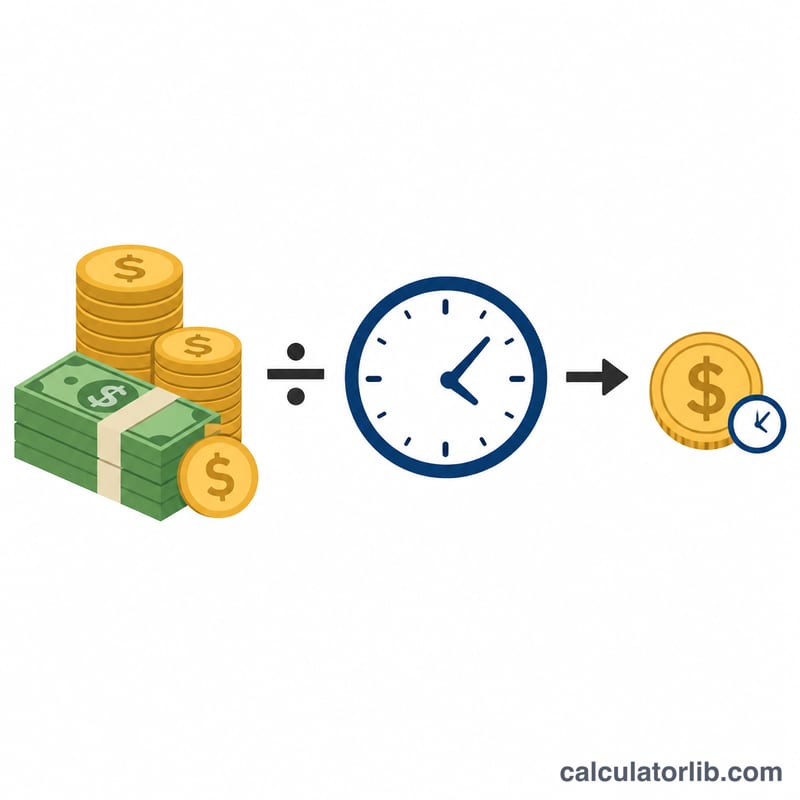
The math is simple: \(\text{Hourly} = \dfrac{\text{Total Pay}}{\text{Total Hours Worked}}\). Dividing money earned by time spent gives the rate of pay for each hour. The equivalents extend this rate: daily multiplies by 8 hours, weekly by 40 hours, and annual by \(40 \times 52 = 2{,}080\) working hours.
Worked Example
Suppose you earned $800 for 40 hours of work. Your hourly wage is $$\$800 \div 40 = \$20.00 \text{ per hour}$$ That equals $160 per day, $800 per week, and $41,600 per year at full-time hours.
Interpreting Your Hourly Wage Result
The number this calculator returns is a simple average: total pay divided by total hours worked.
$$\text{Hourly Wage} = \frac{ {\text{Total Pay}}}{ {\text{Total Hours}}}$$Because it divides everything you were paid by every hour you logged, it is a blended (effective) rate — not your contractual base rate. If your total pay includes overtime premiums, shift differentials, commissions or a bonus, the result sits above your base rate; if you had partly paid hours or unpaid overtime folded into the hours figure, it sits below. To recover a true base rate, enter only base pay and only the hours that base pay covers.
A worked example: someone paid $1,240 for 48 hours in a week gets $25.83 per hour:
$$\frac{\$1{,}240}{48\ \text{h}} = \$25.83\ \text{per hour}$$Note that this single figure hides the fact that 40 hours may have been paid at one rate and 8 at a premium.
Gross vs. take-home
If the pay you entered was gross pay (the figure before deductions), the result is a pre-tax, pre-deduction hourly rate. Income tax, social insurance or payroll contributions, pension or retirement contributions, and health or union deductions are not reflected. Your take-home hourly rate is always lower, and by how much depends entirely on your country, jurisdiction and personal circumstances. Enter net pay instead if you want an after-deduction rate — but be aware the two results are not comparable to each other.
What the annual figure assumes
The equivalent annual pay shown alongside your hourly wage is an annualisation, not a forecast. It assumes you keep working the same hours at the same rate for 52 paid weeks, with no unpaid leave, no unpaid holidays, no sick days beyond what is paid, no furlough and no seasonal slowdown. For salaried employees with paid vacation this is usually a reasonable approximation. For hourly, casual, seasonal or freelance work it is typically optimistic — if you realistically bill or work 46 weeks rather than 52, scale the annual figure by \(46/52 \approx 0.885\), roughly an 11.5% reduction.
Overtime and the "regular rate" (United States)
This point is specific to the United States: under the federal Fair Labor Standards Act (FLSA), non-exempt employees must be paid at least 1.5× their regular rate for hours worked beyond 40 in a workweek. Notably, the FLSA's "regular rate" is itself computed as a division much like this calculator's — total remuneration for the workweek divided by the total hours actually worked — and it must include most non-discretionary payments such as shift differentials, production bonuses and commissions, not just base pay. So a blended rate like the one above can be a useful sanity check on whether an overtime premium was applied to the correct base. Some US states (California, for example) add daily overtime thresholds and their own rules, and many other countries set entirely different thresholds, multipliers or averaging periods. Check the law that applies where you work.
Unpaid hours quietly lower your effective rate
Any time you give to the job but are not paid for pulls the real rate down. Unpaid setup and closing tasks, mandatory training, on-call waiting time, travel between sites, tool cleaning, or an unpaid commute all count. Add those hours to the denominator to see the true picture: $1,000 for 40 paid hours is $25.00 per hour, but with 5 unpaid hours each week the same pay spread over 45 hours is $22.22 — an 11% cut in effective pay. Running the calculation both ways, once with paid hours and once with all hours, is the fastest way to compare two jobs honestly. (Whether such hours are legally compensable depends on your jurisdiction; in the US, for instance, compensable "hours worked" is a defined legal concept.)
This section is general information to help you read the calculator's output, not financial, tax or legal advice. For questions about your own pay, deductions or overtime entitlement, consult a qualified professional or your local labour authority.
Income and jobs: United States
Average income and unemployment in United States compared with the world, from the World Bank: a benchmark for the figures you enter above.
- GNI per capita 2025
- 88,810 USD
- GDP per capita, PPP 2025
- 90,027 intl. $
- World: 25,704
- Unemployment 2025
- 4.2%
- World: 4.8%
Latest change Up +7.1% 2025: 88,810 USD, against 82,910 USD in 2024. CalculatorLib computes this change from the two published figures.
In 2025, gross national income per person in United States was 88,810 US dollars a year, about 7,401 US dollars a month. World: 14,244 USD
| Year | GNI per capita (USD) | GDP per capita, PPP (intl. $) | Unemployment |
|---|---|---|---|
| 2025 | 88,810 | 90,027 | 4.2% |
| 2024 | 82,910 | 86,170 | 4.0% |
| 2023 | 79,950 | 82,587 | 3.6% |
| 2022 | 77,230 | 78,009 | 3.7% |
| 2021 | 71,510 | 71,441 | 5.3% |
| 2020 | 64,630 | 64,465 | 8.1% |
| 2019 | 65,840 | 65,228 | 3.7% |
| 2018 | 63,040 | 62,876 | 3.9% |
| 2017 | 58,860 | 60,048 | 4.4% |
| 2016 | 56,830 | 57,977 | 4.9% |
GNI per capita (Atlas method) is the average of all income in the economy, not a typical salary; PPP dollars adjust for local prices.
Income tax and social security: United States
- Top income tax rate 2025
- 43.65%
- from 8.7 × the average wage
- Employee social security 2025
- 7.65% · 1.45%
In 2025, the top statutory personal income tax rate in United States (central and local government combined) was 43.65%. It applies from 8.7 times the average wage of 73,520 USD, that is from about 642,101 USD a year.
Employee social security contribution rates for successive earnings bands, lowest band first; the band limits are not shown.
Top income tax rates in OECD countries
| Country | Top rate | Applies from (× average wage) | Year |
|---|---|---|---|
| Japan | 55.95% | 7.7 | 2025 |
| France | 55.37% | 12.9 | 2025 |
| South Korea | 49.5% | 19.0 | 2025 |
| Germany | 47.48% | 4.4 | 2025 |
| United Kingdom | 45% | 2.2 | 2025 |
| United States | 43.65% | 8.7 | 2025 |
| Türkiye | 40.76% | 5.6 | 2025 |
| Mexico | 35% | 20.6 | 2025 |
The top rate is the statutory rate on the highest earnings, not the rate most workers pay. OECD figures cover OECD member countries only.
United States and other countries
GNI per capita in current US dollars (Atlas method) — each country’s latest published year.
- United States 88,810 USD (2025)
- France 48,630 USD (2025)
- Japan 38,340 USD (2025)
- South Korea 37,880 USD (2025)
- Saudi Arabia 36,070 USD (2025)
- Türkiye 16,300 USD (2025)
- Russia 15,960 USD (2025)
- World 14,244 USD (2025)
- China 14,230 USD (2025)
- Mexico 13,730 USD (2025)
- Vietnam 4,970 USD (2025)
- India 2,760 USD (2025)
No published figure yet for Taiwan.
Years can differ between rows: each figure is shown with its own year. The same World Bank indicator for every country.
Latest figure: 2025 Data last updated 2026-10-18 · current
Source: The World Bank Group CC BY 4.0; OECD, Tax Database CC BY 4.0
Monthly figures are computed by CalculatorLib from these data. The top-rate threshold in national currency (multiple × average wage) is computed by CalculatorLib from these data.
Source details and methodology
- The World Bank Group — World Development Indicators (NY.GNP.PCAP.CD, NY.GDP.PCAP.PP.CD, SL.UEM.TOTL.ZS)
- OECD, Tax Database — Top statutory personal income tax rate; employee social security contribution rates
FAQ
Should I include overtime hours? Yes — enter all hours worked and the total pay received so the average hourly rate reflects everything you were paid.
Is this my gross or net wage? It depends on the pay figure you enter. Use gross pay for your pre-tax hourly rate, or net pay for your take-home hourly rate.
Why does annual use 2,080 hours? A standard full-time year is \(40 \text{ hours} \times 52 \text{ weeks} = 2{,}080 \text{ hours}\). The annual estimate assumes full-time work; adjust expectations if you work part-time.