
What is the Baby Percentile Calculator?
Growth charts express a child's size as a percentile — the percentage of same-age, same-sex children who weigh less, are shorter, or have a smaller head circumference. A 60th percentile weight means the baby is heavier than 60% of peers. This tool turns a raw measurement into a percentile using the internationally used LMS method employed by the WHO and CDC growth standards.
How to use it
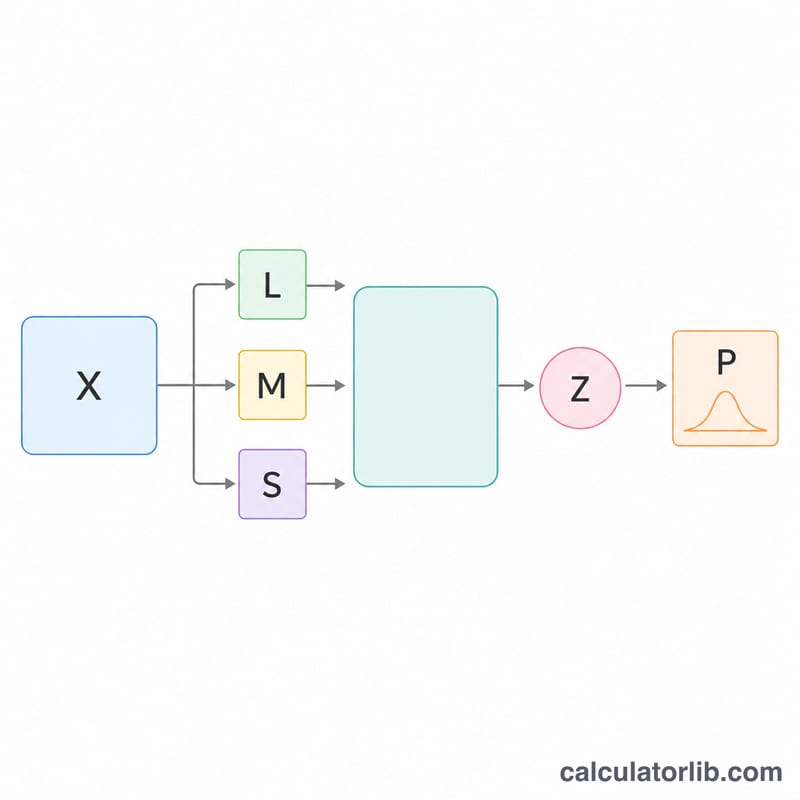
Choose what you measured (weight, length, or head circumference) and the baby's sex. Enter the measurement, then enter the three LMS reference parameters — L, M, and S — taken from the official growth-chart table for your baby's exact age in days or months. The calculator returns the percentile and the underlying z-score.
The formula explained
The LMS method models the skewed distribution of body measurements with a Box-Cox transformation. The z-score is:
$$z = \frac{(X/M)^{L} - 1}{L \cdot S}$$
where X is the measurement, M is the median, L is the power that removes skewness, and S is the coefficient of variation. When L is essentially zero the formula becomes \(z = \ln(X/M)/S\). The z-score is then passed through the standard normal CDF, \(\Phi(z)\), and multiplied by 100 to give a percentile.
Worked example
A baby boy weighs 5.5 kg. The reference table gives L = 0.3487, M = 5.5, S = 0.13. Because X = M, \((X/M)^{L} = 1\), so the numerator is 0 and \(z = 0\). \(\Phi(0) = 0.5\), giving the 50th percentile — exactly the median, as expected.
WHO LMS Reference Values by Age
The WHO Child Growth Standards express each growth chart with three age- and sex-specific parameters: \(L\) (Box-Cox power), \(M\) (median), and \(S\) (coefficient of variation). These plug directly into the z-score formula \(z = \dfrac{(X/M)^{L} - 1}{L \cdot S}\). The sample values below are drawn from the WHO Child Growth Standards (0–24 months) and are intended for orientation; always use the complete official tables for clinical work.
Weight-for-age (kg) — Boys
| Age | L | M (kg) | S |
|---|---|---|---|
| Birth (0 mo) | 0.3487 | 3.3464 | 0.14602 |
| 1 month | 0.2297 | 4.4709 | 0.13395 |
| 2 months | 0.1970 | 5.5675 | 0.12385 |
| 3 months | 0.1738 | 6.3762 | 0.11727 |
| 6 months | 0.1257 | 7.9340 | 0.10958 |
| 12 months | 0.0486 | 9.6479 | 0.10958 |
| 24 months | -0.0507 | 12.1515 | 0.10903 |
Weight-for-age (kg) — Girls
| Age | L | M (kg) | S |
|---|---|---|---|
| Birth (0 mo) | 0.3809 | 3.2322 | 0.14171 |
| 1 month | 0.1714 | 4.1873 | 0.13724 |
| 2 months | 0.0962 | 5.1282 | 0.13000 |
| 3 months | 0.0402 | 5.8458 | 0.12619 |
| 6 months | -0.0756 | 7.2970 | 0.12204 |
| 12 months | -0.1668 | 8.9481 | 0.12619 |
| 24 months | -0.1862 | 11.4775 | 0.13107 |
Length/Height-for-age (cm) — Boys
| Age | L | M (cm) | S |
|---|---|---|---|
| Birth (0 mo) | 1 | 49.8842 | 0.03795 |
| 6 months | 1 | 67.6236 | 0.03165 |
| 12 months | 1 | 75.7488 | 0.03317 |
| 24 months | 1 | 87.8161 | 0.03608 |
Head circumference-for-age (cm) — Boys
| Age | L | M (cm) | S |
|---|---|---|---|
| Birth (0 mo) | 1 | 34.4618 | 0.03686 |
| 6 months | 1 | 43.3306 | 0.02906 |
| 12 months | 1 | 45.9531 | 0.02873 |
| 24 months | 1 | 48.2756 | 0.02862 |
For length-for-age and head circumference-for-age the WHO standard uses \(L = 1\), which makes the z-score reduce to a simple relative deviation from the median. The full WHO tables (every week to 13 weeks, then every month to 60 months) and the corresponding CDC reference tables are available from the WHO Multicentre Growth Reference Study and the CDC growth chart data files. Enter the row matching your baby's exact age and sex into the calculator's L, M, and S fields.
Interpreting Your Baby's Percentile
A percentile tells you where your baby falls relative to a reference population of healthy children of the same age and sex. A weight at the 60th percentile means roughly 60% of reference babies weigh less and 40% weigh more — it is a position on a distribution, not a grade or a health verdict.
The WHO generally regards measurements between the 3rd and 97th percentiles as within the normal range. Values outside this band (or rapid crossing of percentile lines) are worth discussing with a pediatrician, but a single reading near the edge is rarely meaningful on its own.
Z-score to percentile correspondence
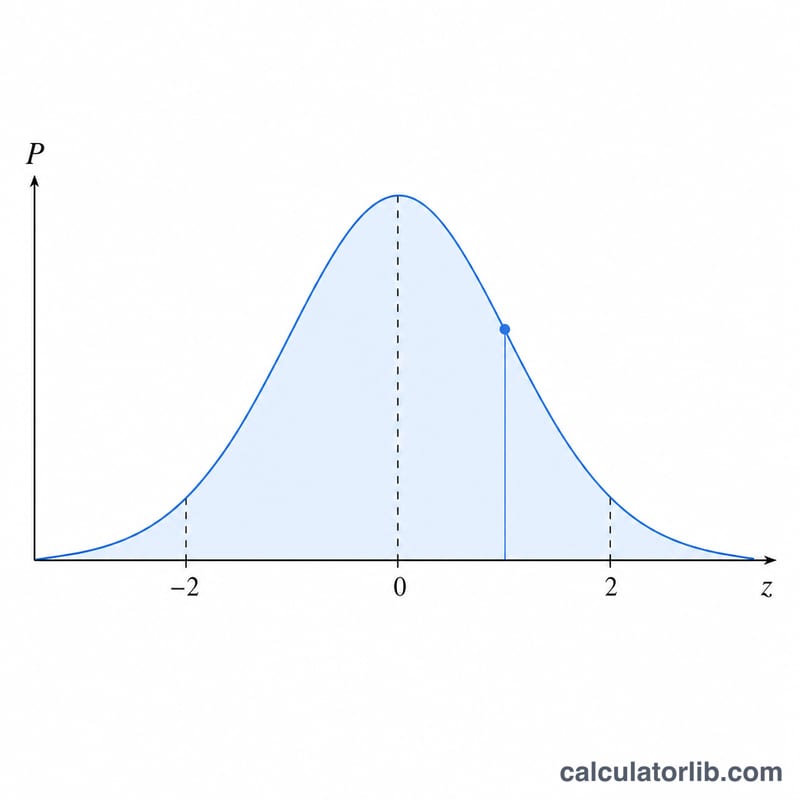
The z-score is converted to a percentile through the standard normal cumulative distribution function, \(P = \Phi(z)\times 100\). Common landmarks:
| Z-score | Percentile | Meaning |
|---|---|---|
| -2 | 2.3 | WHO lower flag (−2 SD) |
| -1 | 15.9 | Below median, normal |
| 0 | 50 | Exactly the median |
| +1 | 84.1 | Above median, normal |
| +1.88 | 97 | ≈ 97th percentile |
| +2 | 97.7 | WHO upper flag (+2 SD) |
Track the curve, not the dot
The most informative pattern is consistency over time. A baby who tracks steadily along the 25th percentile from month to month is typically growing well, even though that is below average. Sudden jumps or drops across two or more major percentile lines — in either direction — are the signal worth investigating, far more than the absolute percentile value itself.
Percentiles describe population position, not diagnosis. Many perfectly healthy babies sit near the 5th or 95th percentile, often reflecting parental size. If you are concerned about your child's growth, feeding, or development, share the plotted trend with your pediatrician rather than reacting to one measurement. This is general information, not professional medical advice.
Key Terms Explained
- Percentile
- The percentage of the reference population that falls at or below a given measurement. A baby at the 70th percentile for weight is heavier than about 70% of same-age, same-sex reference children.
- Z-score (standard deviation score)
- How many standard deviations a measurement lies above (positive) or below (negative) the median, after the Box-Cox adjustment. It is the input to the percentile conversion: \(z = \dfrac{(X/M)^{L} - 1}{L \cdot S}\).
- L — Box-Cox power
- A skewness parameter that corrects for the fact that growth data are not perfectly symmetric. When \(L = 1\) the distribution is treated as normal; otherwise it applies a power transformation so the data become approximately normal before the z-score is taken.
- M — median
- The 50th-percentile (median) value of the measurement for that exact age and sex. A measurement equal to \(M\) gives \(z = 0\) and a percentile of 50.
- S — coefficient of variation
- The relative spread of the distribution (roughly the standard deviation divided by the median). Larger \(S\) means the percentile lines are spaced farther apart at that age.
- Standard normal CDF (\(\Phi\))
- The cumulative distribution function of the standard normal distribution. It maps a z-score to a probability between 0 and 1; multiplying by 100 yields the percentile, \(P = \Phi(z)\times 100\).
- Weight-for-age
- A growth indicator comparing body weight to the reference for a child's age and sex; sensitive to recent nutrition and acute changes.
- Length/height-for-age
- Compares body length (measured lying down under 2 years) or standing height to the reference; reflects longer-term, cumulative growth.
- Head circumference-for-age
- Compares the largest circumference of the head to the reference; a key screen for brain growth and neurological development in infancy.
FAQ
Where do I find L, M and S? From WHO Child Growth Standards or CDC growth-chart data tables, which list LMS values for each age and sex.
Is a higher percentile better? No. Percentiles describe where a child sits in the population, not health. Steady tracking along a curve matters more than the absolute number.
What does a z-score of 2 mean? It is two standard deviations above the median, roughly the 97.7th percentile.