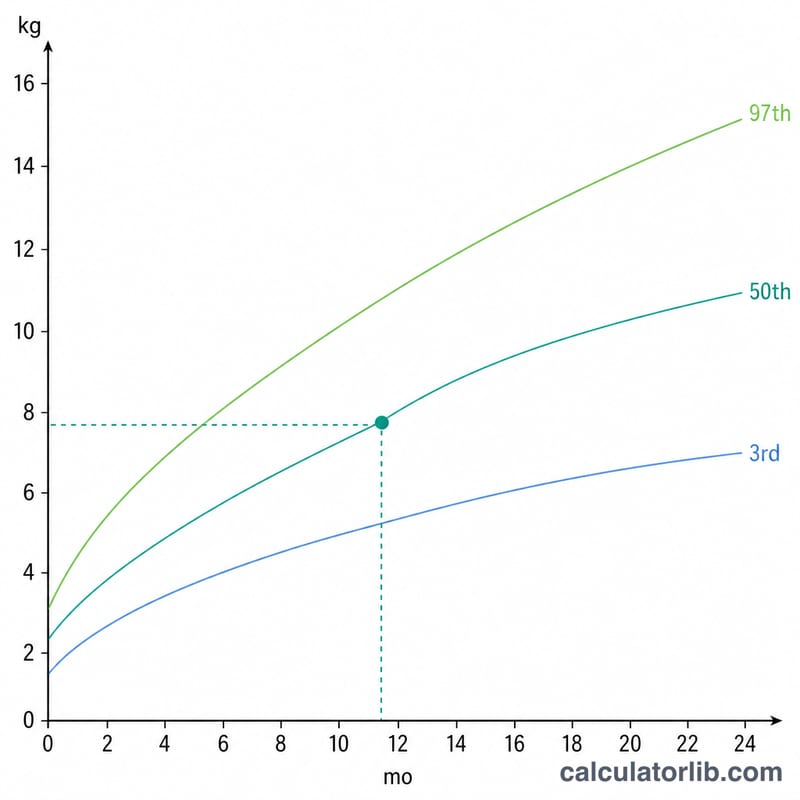
What is the Baby Weight-for-Age Percentile Calculator?
This tool estimates where a baby's weight falls relative to other children of the same age and sex, using the World Health Organization (WHO) Child Growth Standards for ages 0–24 months. A percentile of 50 means the baby is exactly average; a percentile of 84 means the baby weighs more than about 84% of children of the same age and sex.
How to use it
Select the baby's sex, enter the age in completed months (0–24), and enter the current weight in kilograms. The calculator looks up the WHO reference mean weight and standard deviation (SD) for that age and sex, computes a z-score, and converts it into a percentile.
The formula explained
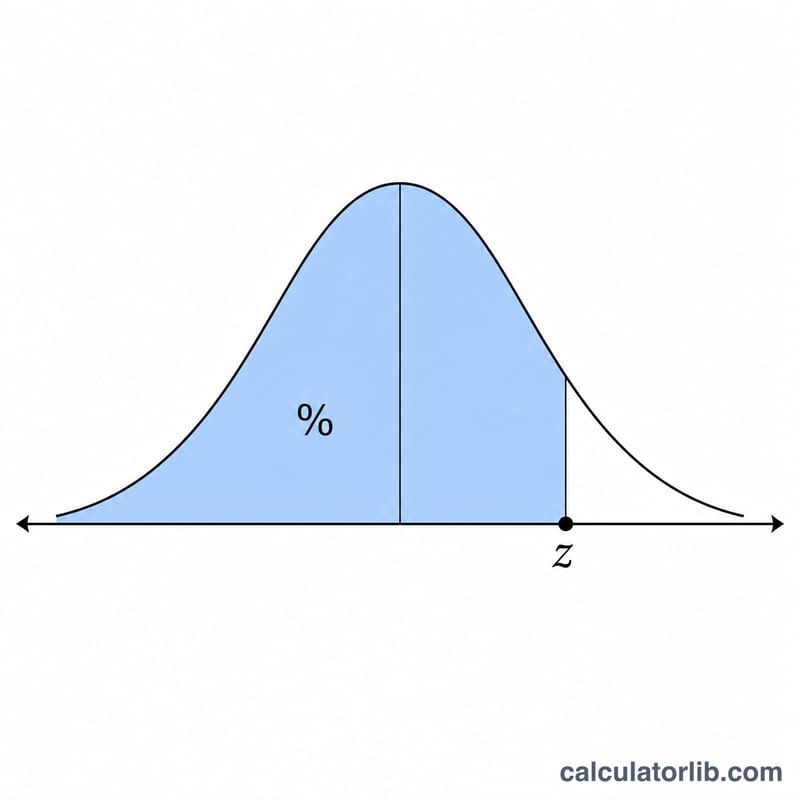
The z-score measures how many standard deviations the baby's weight is from the reference mean: \(z = (\text{weight} - \text{mean}) / \text{SD}\). The percentile is the cumulative standard-normal probability of that z-score: \(\text{percentile} = \Phi(z) \times 100\), where \(\Phi\) is the standard normal cumulative distribution function. A \(z\) of 0 maps to the 50th percentile, +1 to about the 84th, and −1 to about the 16th.
Worked example
A 6-month-old girl has a WHO reference mean of 7.297 kg and SD of 0.832 kg. If she weighs 8.129 kg, then $$z = \frac{8.129 - 7.297}{0.832} = 1.0,$$ which corresponds to the 84.1th percentile — she is heavier than about 84% of girls her age.
WHO Weight-for-Age Reference Values (0–24 Months)
The WHO Child Growth Standards model weight-for-age using the LMS method, where each age has three parameters: \(L\) (Box-Cox power / skewness), \(M\) (median weight in kg) and \(S\) (coefficient of variation). The z-score is computed from these as
$$z = \frac{\left(\dfrac{\text{weight}}{M}\right)^{L} - 1}{L \times S}$$The median \(M\) is the 50th-percentile weight at that age. The tables below list selected WHO LMS values for boys and girls from birth to 24 months.
Boys — Weight-for-Age (kg)
| Age (months) | L | M (median, kg) | S |
|---|---|---|---|
| 0 | 0.3487 | 3.3464 | 0.14602 |
| 1 | 0.2297 | 4.4709 | 0.13395 |
| 2 | 0.1970 | 5.5675 | 0.12385 |
| 3 | 0.1738 | 6.3762 | 0.11727 |
| 4 | 0.1553 | 7.0023 | 0.11316 |
| 5 | 0.1395 | 7.5105 | 0.11080 |
| 6 | 0.1257 | 7.9340 | 0.10958 |
| 9 | 0.0917 | 8.9462 | 0.10827 |
| 12 | 0.0660 | 9.6479 | 0.10958 |
| 15 | 0.0454 | 10.2315 | 0.11209 |
| 18 | 0.0280 | 10.7670 | 0.11498 |
| 21 | 0.0127 | 11.2818 | 0.11800 |
| 24 | -0.0011 | 11.7794 | 0.12100 |
Girls — Weight-for-Age (kg)
| Age (months) | L | M (median, kg) | S |
|---|---|---|---|
| 0 | 0.3809 | 3.2322 | 0.14171 |
| 1 | 0.1714 | 4.1873 | 0.13724 |
| 2 | 0.0962 | 5.1282 | 0.13000 |
| 3 | 0.0402 | 5.8458 | 0.12619 |
| 4 | -0.0050 | 6.4237 | 0.12402 |
| 5 | -0.0430 | 6.8985 | 0.12274 |
| 6 | -0.0756 | 7.2970 | 0.12204 |
| 9 | -0.1507 | 8.2254 | 0.12174 |
| 12 | -0.2024 | 8.9481 | 0.12273 |
| 15 | -0.2402 | 9.5708 | 0.12450 |
| 18 | -0.2691 | 10.1455 | 0.12667 |
| 21 | -0.2920 | 10.6947 | 0.12903 |
| 24 | -0.3110 | 11.2356 | 0.13156 |
Worked example: a 6-month-old boy weighing 8.4 kg. Using \(L = 0.1257\), \(M = 7.9340\), \(S = 0.10958\):
$$z = \frac{\left(\dfrac{8.4}{7.9340}\right)^{0.1257} - 1}{0.1257 \times 0.10958} = \frac{1.00731 - 1}{0.013774} \approx 0.53$$A z-score of \(0.53\) corresponds to roughly the 70th percentile, meaning this baby weighs more than about 70% of healthy boys the same age.
Interpreting Your Baby's Percentile and Z-Score
The percentile tells you where your baby's weight falls relative to the WHO reference population of healthy, breastfed children. A percentile of 60 means the baby weighs more than about 60% of children of the same sex and age. The z-score (standard deviation score) expresses the same information as the number of standard deviations from the median, where 0 is exactly the median (50th percentile).
WHO defines the following weight-for-age cut-offs for screening:
- z below −2 (≈ below 2.3rd percentile): underweight.
- z below −3 (≈ below 0.1st percentile): severely underweight.
- z above +2 (≈ above 97.7th percentile): weight is high for age; WHO advises assessing weight-for-length and BMI-for-age rather than weight-for-age alone, because a tall child can be heavy without being overweight.
- z above +3 (≈ above 99.9th percentile): requires assessment for possible weight-related concerns, again primarily through weight-for-length/BMI-for-age.
Most healthy babies fall between the −2 and +2 z-scores (about the 2nd to 98th percentiles). The number alone does not diagnose anything — a baby on the 9th percentile who is feeding well, active and developing normally may simply be naturally small.
Tracking matters more than a single value. Plotting several measurements over time shows the growth trajectory. A baby who consistently follows along their own curve — even a lower one — is generally growing well. What clinicians watch for is crossing two or more major percentile lines (up or down), or flattening of the curve, which can prompt a closer look at feeding and health. A single point is a snapshot, not a trend.
This is general educational information, not medical advice. Always discuss your child's growth with a pediatrician or qualified health professional, who will consider weight together with length/height, head circumference, history and overall development.
WHO Z-Score and Percentile Cutoffs
Because z-scores follow the standard normal distribution, each z-score maps to a fixed percentile through the cumulative normal function \(P = \Phi(z)\times100\%\). The table below shows the standard cut-offs WHO uses for weight-for-age, with the corresponding approximate percentiles and classification labels.
| Z-score | Approx. percentile | WHO weight-for-age classification |
|---|---|---|
| −3 | 0.1st | Severely underweight |
| −2 | 2.3rd | Underweight |
| −1 | 15.9th | Within normal range (low side) |
| 0 | 50th | Median (normal) |
| +1 | 84.1st | Within normal range (high side) |
| +2 | 97.7th | High weight-for-age — assess with weight-for-length/BMI |
| +3 | 99.9th | Very high weight-for-age — assess with weight-for-length/BMI |
The percentile range from −2 to +2 (about the 2nd to 98th percentiles) is considered the normal range for weight-for-age. Note that WHO does not label high weight-for-age as "overweight" by itself; overweight and obesity in young children are screened using weight-for-length or BMI-for-age, which account for the child's stature.
FAQ
Is a low percentile bad? Not necessarily. Healthy babies span a wide range. Consistent growth along a curve matters more than a single number. Always discuss concerns with your pediatrician.
Which standard is used? The WHO Child Growth Standards (2006), which describe how children should grow under optimal conditions, for ages 0–24 months.
Should I use kilograms or pounds? Enter weight in kilograms. To convert, divide pounds by 2.20462.