
What Is the Birth Weight Percentile Calculator?
This tool estimates where a newborn's birth weight falls compared with other babies of the same gestational age and sex. It reports both a percentile (0–100) and a z-score. A percentile of 50 means the baby weighs exactly the reference average; a percentile of 10 means roughly 90% of same-age babies weigh more. The reference means and standard deviations used here are approximate values modeled on population growth charts and are intended for general education, not medical diagnosis.
How to Use It
Enter the gestational age in completed weeks (22–44), select the baby's sex, and type the birth weight in grams or kilograms. The calculator converts everything to grams, looks up the reference mean and standard deviation for that week and sex, computes the z-score, and converts it to a percentile.
The Formula Explained
First the z-score is found: \(z = \frac{w - \mu_{GA}}{\sigma_{GA}}\). This expresses how many standard deviations the baby is from the average. The percentile is then the area under the standard normal curve to the left of z, multiplied by 100: \(P = \Phi(z)\times 100\). We approximate Φ with the Abramowitz & Stegun error-function formula, accurate to within ~0.1 percentile.
$$z = \frac{w - \mu_{GA}}{\sigma_{GA}}, \quad P = \Phi(z)\times 100$$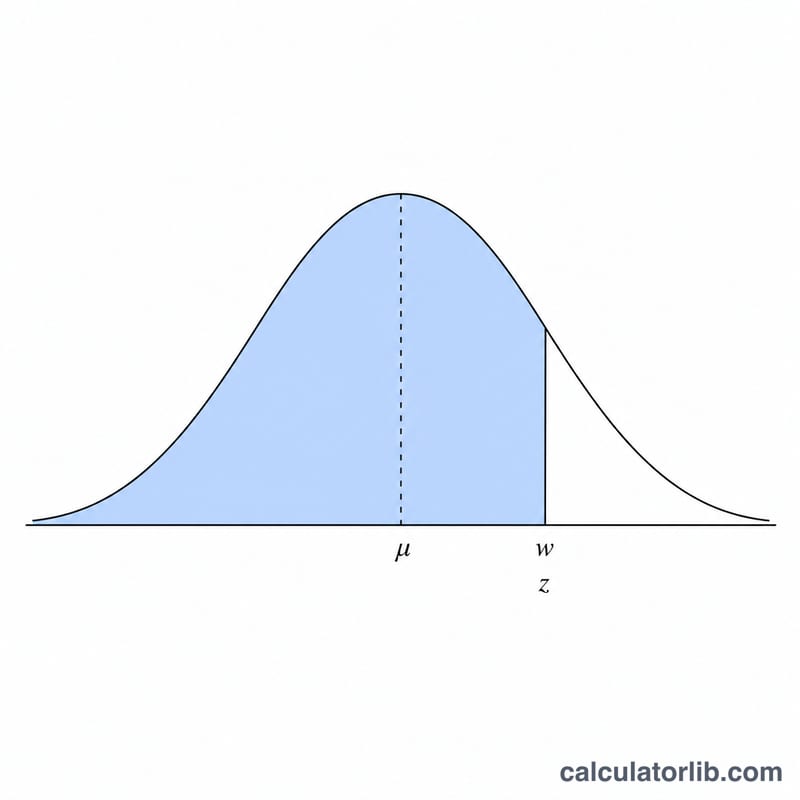
Worked Example
A boy born at 40 weeks weighing 3,600 g. The reference mean for 40-week boys is 3,600 g with SD 460 g, so \(z = \frac{3600 - 3600}{460} = 0\). \(\Phi(0) = 0.5\), giving the 50th percentile — exactly average.
$$z = \frac{3600 - 3600}{460} = 0$$
Interpreting Your Birth Weight Percentile and Z-Score
A birth weight percentile tells you how a newborn's weight compares with a reference population of babies of the same sex and gestational age (GA). A percentile of 40, for example, means roughly 40% of same-age, same-sex infants weigh less and about 60% weigh more. The accompanying z-score expresses the same information as the number of standard deviations the baby's weight sits above or below the mean for its gestational age, using \(z = \frac{w - \mu_{GA}}{\sigma_{GA}}\).
Clinicians group birth weight into three standard screening categories based on the percentile:
- SGA (Small for Gestational Age) — birth weight below the 10th percentile for GA and sex (z < about −1.28). SGA can reflect a constitutionally small but healthy baby or growth restriction.
- AGA (Appropriate for Gestational Age) — birth weight between the 10th and 90th percentiles (z between about −1.28 and +1.28). This is the expected range for most newborns.
- LGA (Large for Gestational Age) — birth weight above the 90th percentile for GA and sex (z > about +1.28). LGA is associated with factors such as maternal diabetes, but many LGA babies are simply large and healthy.
Converting between z and percentile uses the standard normal cumulative distribution, \(P = \Phi(z)\times 100\). For instance, a z-score of \(+1.0\) corresponds to roughly the 84.1th percentile, and a z-score of \(-1.28\) maps to about the 10th percentile.
These categories are screening labels derived from population reference charts, not diagnoses. A single percentile does not by itself indicate a problem — interpretation depends on the chart used, the accuracy of the gestational age estimate, growth trend over time, and the full clinical picture. Always discuss results with a qualified healthcare provider. This is general information, not professional medical advice.
Percentile and Z-Score Reference Thresholds
The table below shows how key z-scores map to percentiles under the standard normal distribution and how those percentiles correspond to the SGA / AGA / LGA screening categories. Percentiles are rounded to one decimal place.
| Z-Score | Percentile | Category |
|---|---|---|
| −2.00 | 2.3 | SGA (< 10th) |
| −1.28 | 10.0 | SGA / AGA boundary |
| 0.00 | 50.0 | AGA (median) |
| +1.28 | 90.0 | AGA / LGA boundary |
| +2.00 | 97.7 | LGA (> 90th) |
To find the exact z-score that corresponds to a target percentile (the inverse of the above), use a percentile-to-z conversion. The 10th-percentile threshold, for example, corresponds to a z of about −1.28 and the 90th to about +1.28.
FAQ
What counts as small or large for gestational age? Below the 10th percentile is generally termed small for gestational age (SGA); above the 90th is large for gestational age (LGA).
Is this a medical assessment? No. It uses approximate reference values and should not replace evaluation by a clinician using validated charts (e.g., Fenton, WHO, INTERGROWTH-21st).
What gestational ages are supported? 22 to 44 completed weeks. Values outside this range are clamped to the nearest supported week.