What is a height percentile?
Your height percentile tells you what fraction of a reference population is shorter than you. If you are in the 70th percentile, you are taller than 70% of people in that group and shorter than 30%. This calculator models adult height as a normal (bell-shaped) distribution and uses default means and standard deviations for US adults: 175.4 cm (mean) / 7.6 cm (SD) for men and 161.5 cm / 7.1 cm for women. You can override these with your own values for any population, age group, or country.
How to use it
Pick your gender to load the matching reference figures, then type your height in centimeters. To compare against a different population (e.g. children of a certain age, or a non-US country), expand the custom section and enter your own mean and standard deviation. The result shows your percentile, your z-score, and how you split the population.
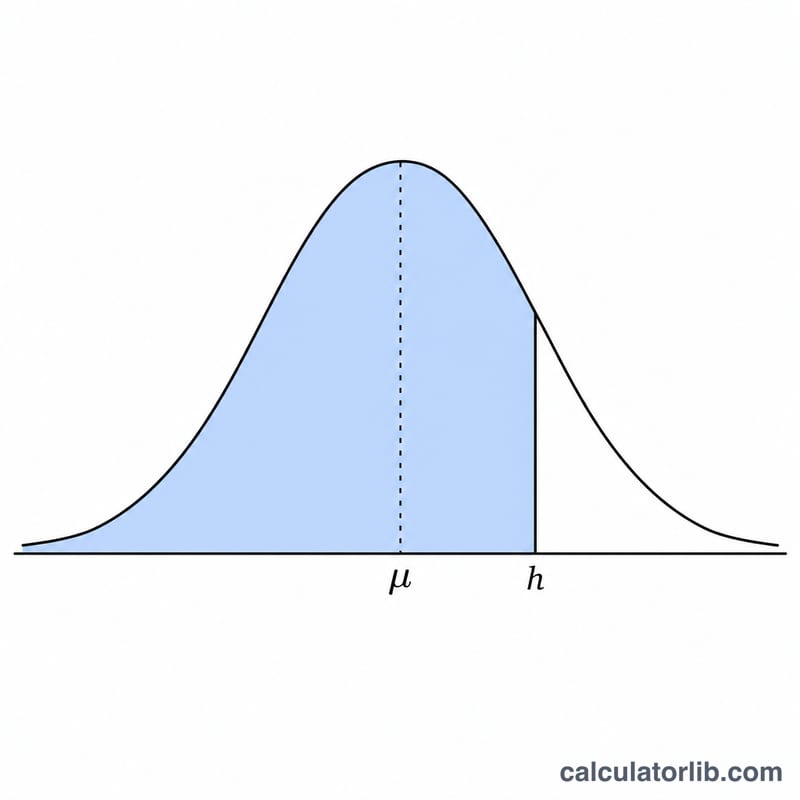
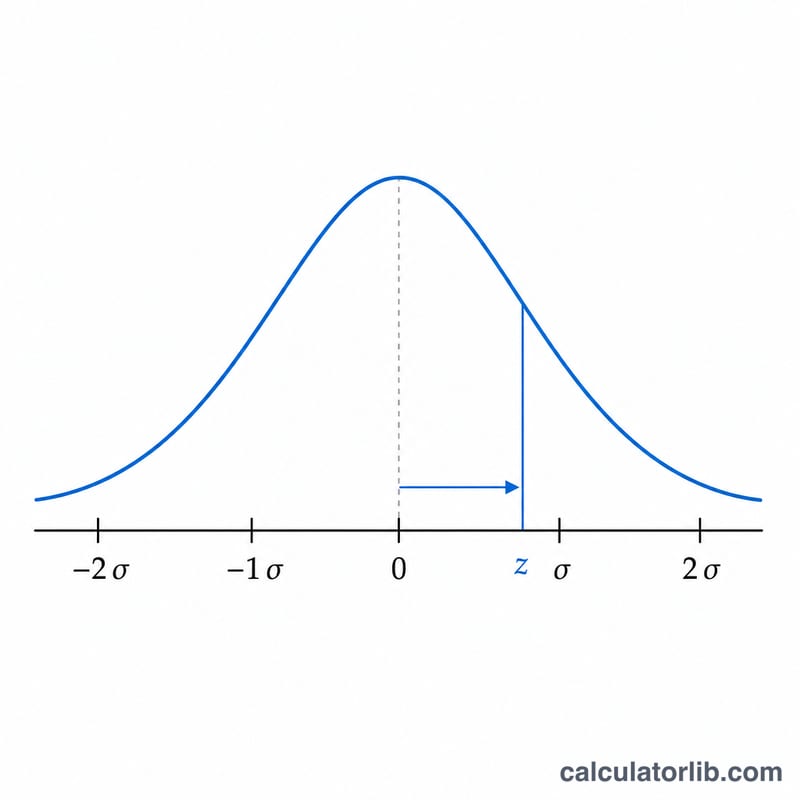
The formula explained
First we compute a z-score: $$z = \frac{h - \mu}{\sigma}$$ This expresses how many standard deviations you are above or below average. A positive z means above average. We then feed z into the standard normal cumulative distribution function \(\Phi(z)\), which returns the probability that a random person is shorter than you. Multiplying by 100 gives the percentile: $$P = \Phi(z) \times 100$$ The calculator approximates \(\Phi\) using the Abramowitz & Stegun error-function formula, accurate to about 1e-7.
Worked example
A man is 183 cm tall. Using the male reference (mean 175.4, SD 7.6): $$z = \frac{183 - 175.4}{7.6} = 1.0$$ The normal CDF of 1.0 is about 0.8413, so the percentile is roughly 84.1. He is taller than about 84% of men.
FAQ
Why is it based on a normal distribution? Adult height closely follows a bell curve within a single sex and population, making the normal model a good approximation.
Can I use it for children? Yes, but enter age-specific mean and SD via the custom fields — children's height distributions differ greatly by age.
Why might my percentile differ from a doctor's chart? Clinical charts use country- and age-specific data (e.g. CDC/WHO) which may differ from these adult defaults; use custom values for an exact match.