What this calculator does
This tool estimates a baby's length-for-age (lying down, under 24 months) or height-for-age percentile based on the WHO Child Growth Standards, which are international references used worldwide for children aged 0–24 months. It converts a measured length into a z-score and then into a percentile, telling you roughly where your child sits compared with healthy children of the same age and sex.
How to use it
Select the child's sex, enter the age in completed months (0 to 24), and enter the measured recumbent length (or standing height) in centimetres. The calculator looks up the median (M) and standard deviation (SD) for that age and sex, computes the z-score, and reports the percentile.
The formula explained
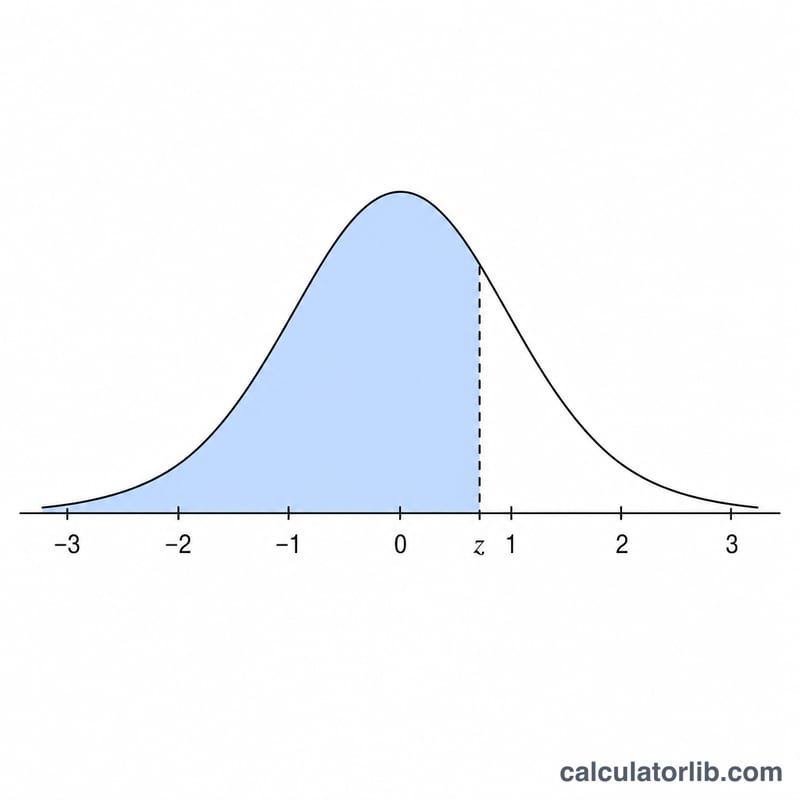
The z-score is $$z = \frac{L - M}{SD}$$ where \(L\) is the measured length, \(M\) is the age- and sex-specific median, and \(SD\) is the standard deviation. The percentile is the value of the standard normal cumulative distribution function, $$P = \Phi(z)\times 100$$ A percentile of 50 means the child is exactly at the median; 90 means longer than 90% of peers; 10 means shorter than 90% of peers.
Worked example
A 6-month-old boy measures 67 cm. The WHO median length at 6 months is about 67.6 cm with an SD near 2.57 cm. The z-score is $$z = \frac{67 - 67.6}{2.57} \approx -0.234$$ giving a percentile of about 41 — a perfectly healthy, near-average result.
Interpreting Your Percentile
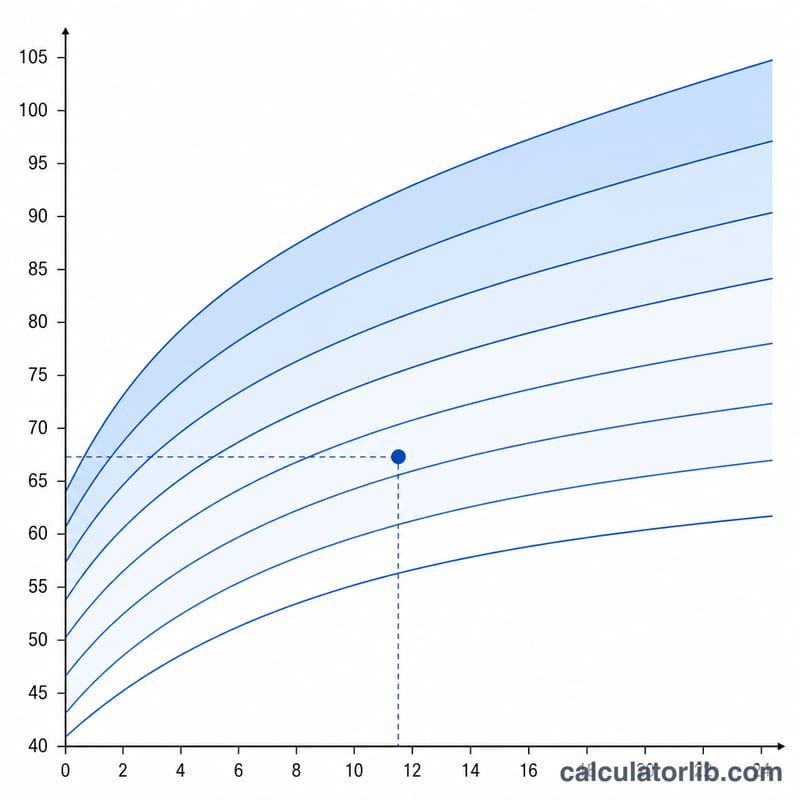
A length-for-age percentile tells you how your baby compares with the WHO reference population of healthy, well-nourished children of the same sex and age. A percentile of 60 means the baby is longer than about 60% of children that age and shorter than the other 40%. The percentile is derived from the z-score through the standard normal distribution.
| Percentile band | Approx. z-score | General interpretation |
|---|---|---|
| Below 3rd | \(z < -1.88\) | Shorter than expected — worth discussing with a clinician |
| 3rd | \(z \approx -1.88\) | Lower end of the typical range |
| 15th | \(z \approx -1.04\) | Within the normal range |
| 50th | \(z = 0\) | At the median (typical) length |
| 85th | \(z \approx +1.04\) | Within the normal range |
| 97th | \(z \approx +1.88\) | Upper end of the typical range |
| Above 97th | \(z > +1.88\) | Taller than expected — usually healthy, but note the trend |
WHO considers measurements falling between roughly the 3rd and 97th percentiles (about \(\pm 2\) z-scores) to be within the normal range for most healthy children. A baby who is consistently around the 10th percentile is not “behind” — small and large healthy babies exist at every percentile.
What matters most is the trend over time: a baby who tracks steadily along their own curve is generally growing well, even at a low or high percentile. A single reading can be affected by measurement technique (recumbent length is notoriously hard to measure precisely) or timing. A sudden crossing of two or more major percentile bands — up or down — is the signal that merits a conversation with your pediatrician, not the absolute number itself.
Key Terms Explained
- Z-score (standard deviation score)
- The number of standard deviations a measurement lies above (positive) or below (negative) the median for a child's sex and age. Here \(z = (\text{length} - M)/SD\). A z-score of 0 is exactly average; \(+2\) and \(-2\) roughly mark the 97th and 3rd percentiles.
- Percentile
- The percentage of children in the reference population shorter than the measured child. The 50th percentile is the median; the 90th means longer than 90% of peers. It is obtained from the z-score via \(P = \Phi(z)\times 100\%\).
- Recumbent length vs. standing height
- For children under 2 years, WHO standards use recumbent length — the baby measured lying flat on a length board. From age 2 onward, standing height is used; a child measures slightly shorter standing than lying, so the two scales are not interchangeable.
- Median (M)
- The middle value of the reference distribution — the length at which exactly half of healthy children are shorter and half longer. M is the center point used in the z-score formula and corresponds to the 50th percentile.
- Standard deviation (SD)
- A measure of how spread out lengths are around the median. A larger SD means more natural variation. This tool approximates the WHO spread as \(SD \approx 0.038\,M\).
- Normal distribution / CDF
- The familiar bell-shaped curve. The cumulative distribution function \(\Phi(z)\) gives the proportion of the curve to the left of a z-score — converting a z-score into a percentile. WHO length-for-age is modeled as approximately normal after the z-score transformation.
- WHO Child Growth Standards
- International growth references published by the World Health Organization in 2006, based on healthy, breastfed children from six countries raised in optimal conditions. They describe how children should grow and are the recommended standard for ages 0–59 months.
FAQ
Is a low percentile bad? Not necessarily. Percentiles between the 3rd and 97th are generally considered normal. Consistent growth along a curve matters more than a single number.
Length or height? Children under 2 are measured lying down (length); older children stand. This tool covers 0–24 months.
Should I replace my doctor's chart? No. This is an educational estimate using simplified WHO medians and approximate SDs. Always consult your pediatrician for medical decisions.