What is the Electricity Carbon Footprint Calculator?
This tool estimates the carbon dioxide (CO₂) emissions produced by your electricity consumption. Because electricity is generated by a mix of sources — coal, gas, nuclear, hydro, wind and solar — every kilowatt-hour (kWh) carries a different amount of CO₂ depending on your local grid. This is captured by the emission factor, measured in kilograms of CO₂ per kWh. The calculator is universal: enter the emission factor that applies to your country or supplier.
How to use it
Enter the electricity you used in kWh (e.g. a monthly bill figure), your grid emission factor in kg CO₂/kWh, and the number of periods to multiply by — for example 12 to turn a monthly figure into an annual total. The result shows total CO₂ in kilograms and tonnes, plus emissions per single period.
The formula explained
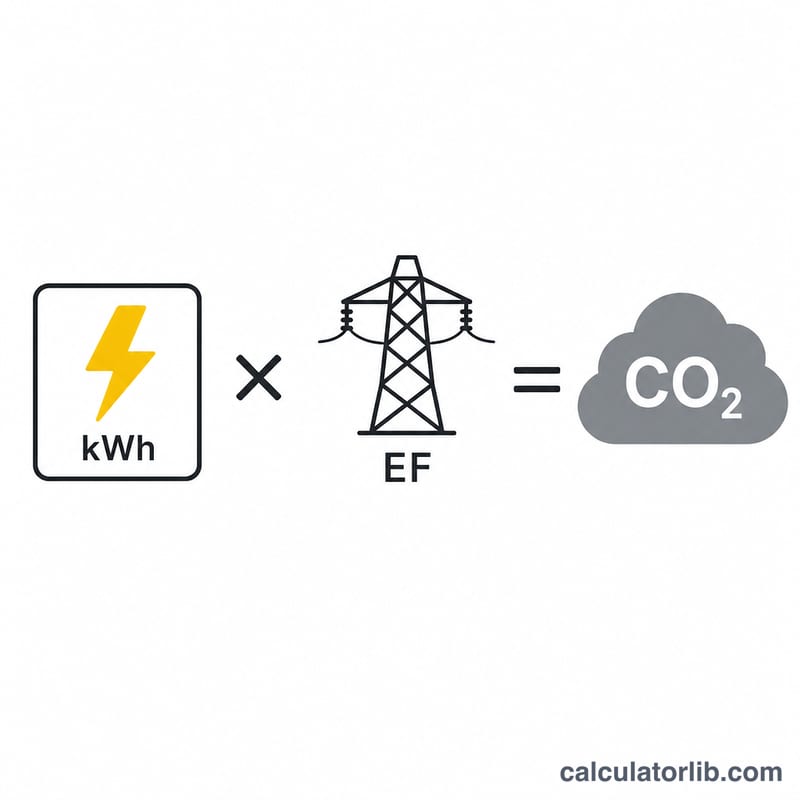
The core equation is simply:
$$\text{CO}_2\ (\text{kg}) = \text{kWh} \times \text{emission factor}$$
To cover several billing periods, the result is multiplied by the number of periods \(n\). Dividing kilograms by 1,000 gives the figure in metric tonnes, the unit most often used for annual footprints.
Worked example
Suppose your home uses 900 kWh per month and your grid emission factor is 0.4 kg CO₂/kWh. Per month that is $$900 \times 0.4 = 360 \text{ kg CO}_2.$$ Over 12 months: $$360 \times 12 = 4{,}320 \text{ kg},$$ or 4.32 tonnes of CO₂ per year.
Typical Grid Emission Factors by Country
The table shows approximate national or regional grid-average emission factors in kg CO₂ per kWh, rounded to a range. Values vary by year, by whether the source counts only CO₂ or CO₂-equivalent (CO₂e), and by whether it measures generation or consumption (including imports and losses). Always check the latest publication from the source before relying on a number. The figures below are indicative only and cover roughly 2022–2023 data.
| Country / region | Approx. factor (kg CO₂/kWh) | Typical publishing source | Approx. reference year |
|---|---|---|---|
| Sweden | about 0.01–0.04 | EEA / IEA | 2022–2023 |
| France | about 0.05–0.06 | EEA / IEA | 2022–2023 |
| United Kingdom | about 0.2 | UK government (DESNZ) conversion factors | 2023 |
| European Union (average) | about 0.2–0.25 | EEA | 2022–2023 |
| United States (average) | about 0.37 | EPA eGRID | 2022 |
| Germany | about 0.38–0.43 | German Environment Agency (UBA) / EEA | 2022–2023 |
| China | about 0.55–0.6 | IEA | 2022 |
| Australia (national average) | about 0.6–0.7 | Australian Government National Greenhouse Accounts Factors | 2023 |
| Poland | about 0.65–0.75 | EEA / IEA | 2022 |
| India | about 0.7–0.8 | Central Electricity Authority (CEA) / IEA | 2022–2023 |
Within large countries, regional grids can differ widely from the national average (for example, between US eGRID subregions or Australian states). If your utility or national agency publishes a more specific factor, use that in the calculator.
Scenario Comparison: Same Usage, Different Grids
The scenarios below use the same household: 900 kWh per month over 12 months (10,800 kWh per year). Only the grid emission factor changes. Each result is \(\text{kWh} \times \text{factor} \times \text{periods}\).
| Factor (kg CO₂/kWh) | kg CO₂ per month | kg CO₂ per year | Tonnes CO₂ per year |
|---|---|---|---|
| 0.05 | 900 × 0.05 = 45 | 45 × 12 = 540 | 0.54 |
| 0.2 | 900 × 0.2 = 180 | 180 × 12 = 2,160 | 2.16 |
| 0.4 | 900 × 0.4 = 360 | 360 × 12 = 4320 | 4.32 |
| 0.7 | 900 × 0.7 = 630 | 630 × 12 = 7,560 | 7.56 |
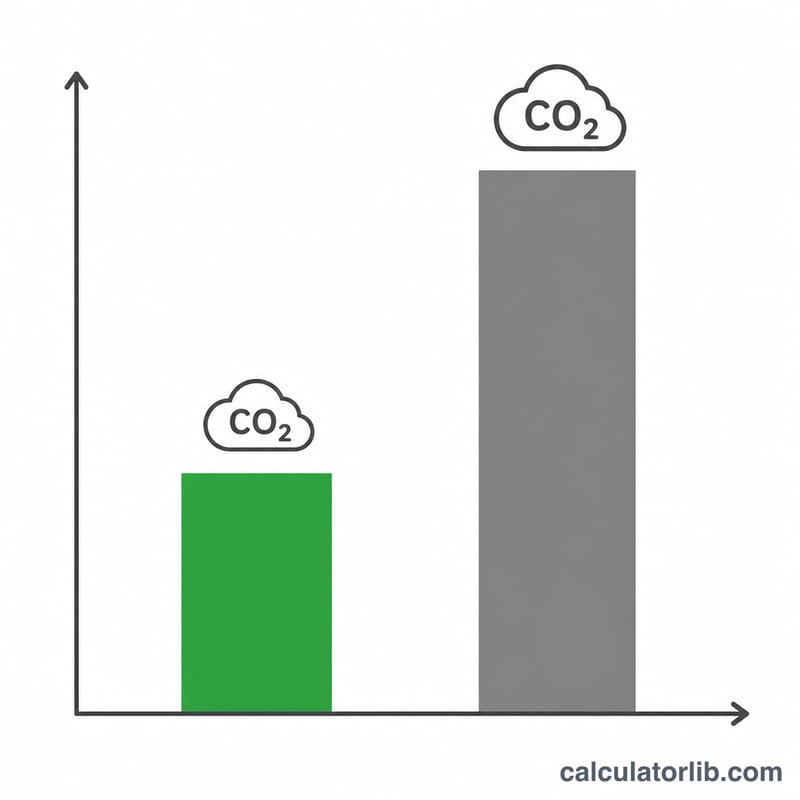
The same consumption produces a 14-fold difference between the lowest and highest factors (540 kg versus 7,560 kg per year). This shows that the grid mix matters as much as the amount of electricity used.
Interpreting Your Result
The calculator uses the relationship
$$\text{CO}_2\ (\text{kg}) = \text{kWh} \times \text{Factor} \times \text{Periods}$$
The result covers only emissions linked to the electricity you consume. It does not include heating fuels, transport, food, goods or other sources, so it is just one part of a total carbon footprint.
- Location-based factors use the average emissions of the grid where the electricity is used. This is what the calculator assumes when you enter a national or regional average.
- Market-based factors reflect the specific supplier, tariff or contractual instruments you have chosen, such as renewable energy certificates or guarantees of origin. A market-based factor can be much lower (or higher) than the grid average. Greenhouse gas accounting standards such as the GHG Protocol report both.
- CO₂ versus CO₂e: some sources publish only CO₂, while others publish CO₂-equivalent, which adds methane and nitrous oxide. Check which one your factor uses, and also whether it covers generation only or includes transmission losses and upstream fuel emissions.
Context: Published per-capita figures, such as those from the IEA and the World Bank, show that total CO₂ emissions per person from energy and industry are roughly 4–5 tonnes per year worldwide on average. Values are far lower in some countries and much higher in others, for example roughly 13–15 tonnes in the United States. Electricity is only one share of these totals, and its share depends heavily on how a country heats, travels and produces goods. Treat your result as a descriptive number, not a judgement.
Results change over time: as grids add renewables and retire coal, published factors usually fall from year to year. Using last year's factor for this year's consumption, or a national average for a region with a different mix, will introduce error. For reporting, use the factor from the same year and the same geography as your consumption.
FAQ
Where do I find my emission factor? National energy or environment agencies publish grid average factors; values typically range from about 0.02 kg/kWh (very clean grids) to over 0.8 kg/kWh (coal-heavy grids).
Does this include heating or transport? No — this calculator covers electricity only. Add separate estimates for gas, fuel and travel for a full footprint.
Why report tonnes? Annual and national carbon targets are usually expressed in tonnes of CO₂, so the conversion helps you compare against benchmarks.