What the Cochran Q test calculator does
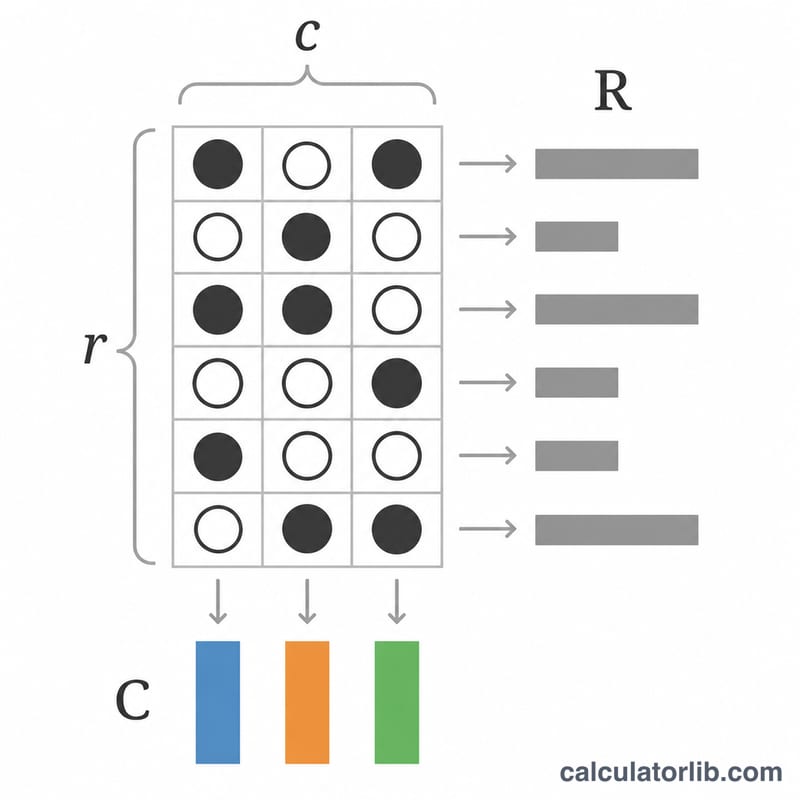
This calculator tests whether c treatments have identical effects when each outcome is binary (0 or 1) and the same r blocks, such as subjects or matched groups, are measured under every treatment. It returns the row and column totals, the Cochran statistic T (often called Q), the chi-square p-value with c-1 degrees of freedom, the critical value and a reject or accept decision. It suits researchers comparing pass/fail, yes/no or present/absent results across several conditions.
How to use it
Enter the 0/1 data table with one block per line and one column per treatment. Separate values with commas, semicolons or spaces. Every line needs the same number of values, at least 2, and only 0 and 1 are accepted. Then choose the significance level alpha: 10%, 5%, 2.5% or 1%. The calculator returns the results at once.
Formula
$$T = c(c-1)\,\frac{\sum_{j=1}^{c}\left(C_j-\frac{N}{c}\right)^2}{\sum_{i=1}^{r}R_i(c-R_i)}$$
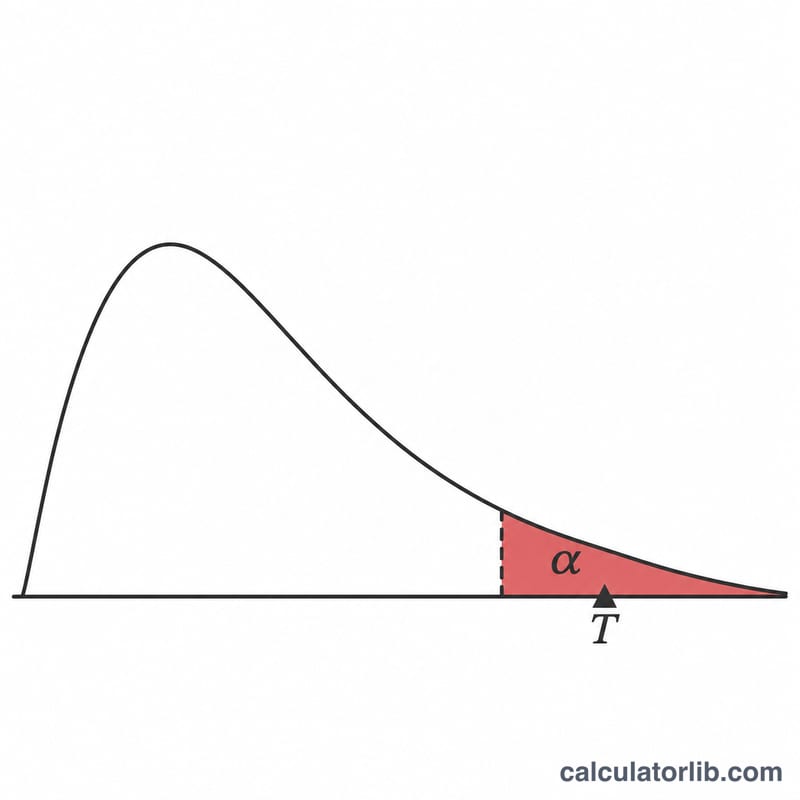
Here \(c\) = number of treatments (columns), \(r\) = number of blocks (rows), \(C_j\) = total of column j, \(R_i\) = total of row i and \(N\) = grand total of all ones. Under the null hypothesis, T follows approximately a chi-square distribution with \(c-1\) degrees of freedom. H0 is rejected when \(T > \chi^2_{1-\alpha,\,c-1}\).
Conventions and assumptions
- The p-value is the upper tail \(P(\chi^2_{c-1} > T)\). For 2 degrees of freedom this equals \(e^{-T/2}\).
- H0 is rejected if T exceeds the critical value, equivalent to p below alpha. Equality counts as accept.
- The chi-square approximation is always used. It assumes r is large, and no minimum is enforced, so small tables should be read with caution.
- No continuity correction or tie handling is applied.
- With c = 2 the test is equivalent to the McNemar test.
- If every block is all 0s or all 1s, the denominator is 0, T is undefined and the request is refused.
Worked example
Twelve blocks and three treatments are entered with alpha = 0.05. The column totals are 8, 10 and 7, the row totals are 3, 3, 1, 2, 0, 3, 3, 2, 1, 1, 3, 3 and the grand total is \(N = 25\), so \(N/c = 25/3\).
$$\sum_i R_i(c-R_i) = 10$$
$$T = 3\times 2\times\frac{\sum_j (C_j - 25/3)^2}{10} = 2.8$$
With \(c-1 = 2\) degrees of freedom, the p-value is \(e^{-2.8/2} = 0.246597\) and the critical value is 5.991. Since \(2.8 < 5.991\), the decision is accept H0: there is no evidence that the treatments differ.
How to read the result and limitations
A large T with a small p-value suggests at least one treatment differs from the others. The test does not say which treatments differ, so follow-up pairwise comparisons, such as McNemar tests with an adjusted alpha, are needed. Blocks with identical outcomes across treatments carry no information about differences but still count in r and in the column totals. With few blocks, the chi-square approximation can be unreliable.
FAQ
What is the Cochran Q test used for?
It compares proportions of successes across three or more related binary samples, where each block is measured under every treatment.
How is it related to McNemar test?
With two treatments, the Cochran statistic reduces to the McNemar test.
Why does the calculator refuse some tables?
If every row is all 0s or all 1s, the denominator is zero and T cannot be computed.
How many blocks do I need?
The approximation needs a reasonably large r. The source gives no numeric cutoff, so none is enforced.
What values are allowed?
Only 0 and 1, with equal numbers of values on every line and at least two columns.
Sources
- Dataplot COCHRAN TEST command reference, NIST Information Technology Laboratory, 2023