What the McNemar test calculator does
This calculator applies the McNemar test to a paired 2x2 table of counts. It checks whether two paired binary measurements, such as a before-and-after result or two diagnostic tests on the same subjects, change in one direction more often than the other. Only the discordant pairs matter. The calculator returns the chi-square statistic with and without continuity correction, the matching p-values, an exact binomial p-value, and a reject or do-not-reject decision.
How to use it
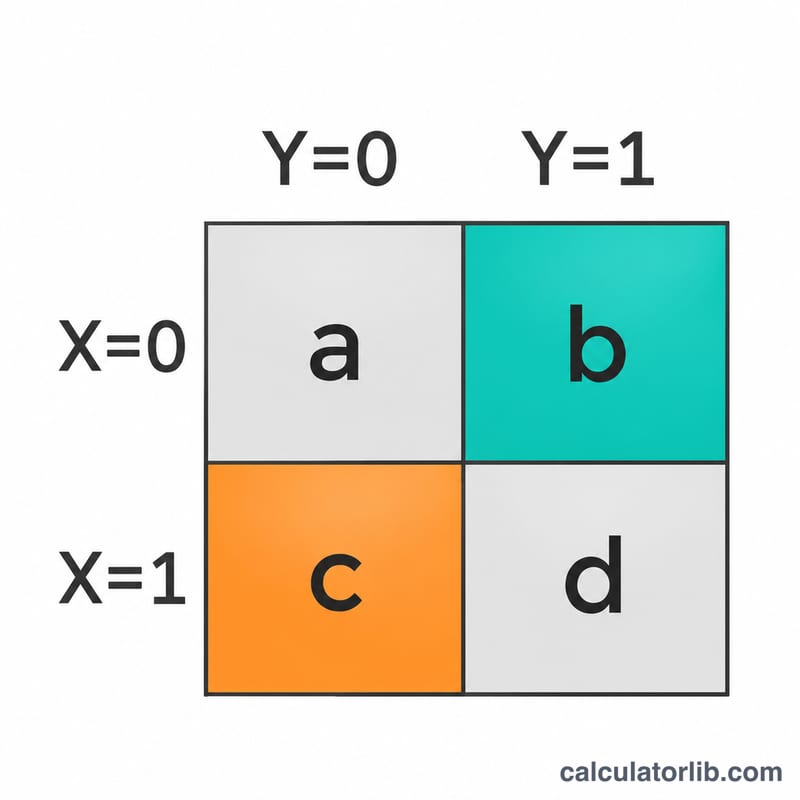
Enter the four cell counts in the order of the form. Cell a is X=0, Y=0. Cell b is X=0, Y=1. Cell c is X=1, Y=0. Cell d is X=1, Y=1. Counts must be non-negative whole numbers. Cells a and d are concordant pairs and do not affect the result. Then choose the two-sided significance level (0.50, 0.20, 0.10, 0.05 or 0.01) and choose whether the large-sample decision uses the statistic with or without continuity correction. The test is undefined when b + c = 0.
Formula
For the large-sample case, with \(b\) and \(c\) the discordant counts:
$$T_1=\frac{(b-c)^2}{b+c}$$$$T_1'=\frac{(|b-c|-1)^2}{b+c}$$\(T_1\) is the uncorrected statistic and \(T_1'\) the continuity-corrected one. Both are compared with a chi-square distribution with 1 degree of freedom, and the p-value is
$$p=\operatorname{erfc}\left(\sqrt{\tfrac{T}{2}}\right)$$For small samples, \(T_2=b\) is compared with a Binomial(\(b+c\), 0.5) distribution, and the two-sided exact p-value is
$$p=\min\left(1,\;2\sum_{i=0}^{k}\binom{n}{i}\frac{1}{2^n}\right),\quad n=b+c,\;k=\min(b,c)$$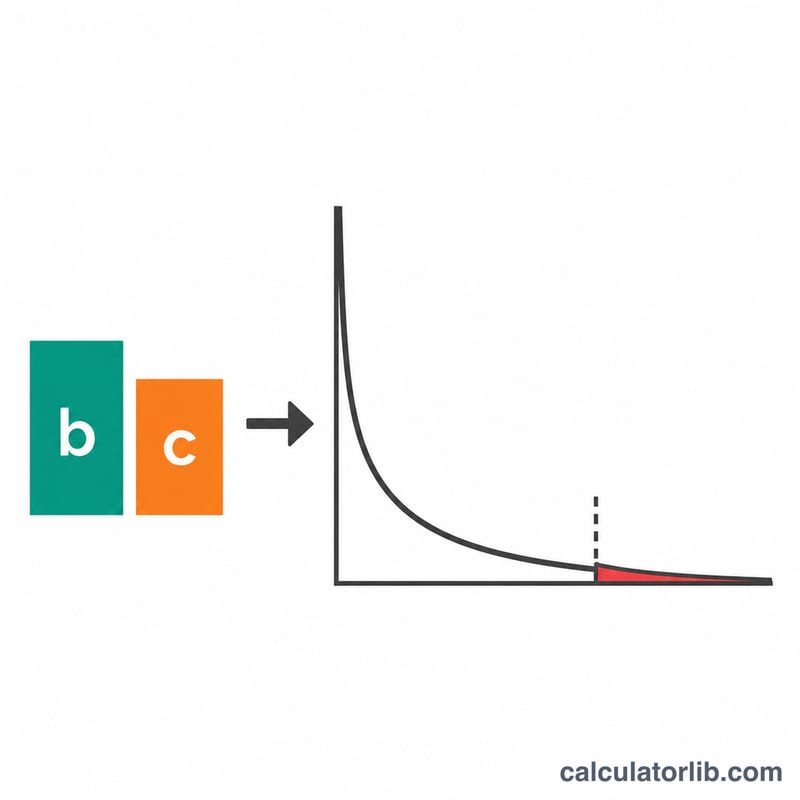
Conventions and assumptions
- Cell layout: rows are variable X and columns are variable Y, so b and c are the discordant counts.
- Hypotheses: H0 states P(X=0,Y=1) = P(X=1,Y=0); the alternative is that they differ (two-sided).
- Method switch: if b + c is greater than 20, the chi-square statistic is used. If b + c is 20 or less, the exact binomial method is used. The source sample output mentions N ≥ 20, but its formula text says b + c > 20, and that threshold is followed here.
- Continuity correction: both statistics are reported, and the selector decides which one drives the large-sample decision.
- Chi-square p-value: the upper tail of chi-square with 1 df. Reject H0 when p ≤ alpha. This is a design choice, since the source gives no p-value formula.
- Exact p-value: doubled lower tail of the binomial, capped at 1. This is also a design choice.
- Rounding: raw values are computed; statistics are displayed to 4 decimals and p-values to 6.
- When b = c, the uncorrected statistic is 0 and p = 1, while the corrected statistic is positive and its p-value is reported as computed.
Worked example
Take a = 63, b = 21, c = 4, d = 12, alpha = 0.05, and no continuity correction. The discordant total is \(b+c=25\), which is above 20, so the chi-square method applies.
$$T_1=\frac{(21-4)^2}{25}=11.56$$$$T_1'=\frac{(|21-4|-1)^2}{25}=10.24$$The p-value without correction is 0.000674 and with correction 0.001374. The exact binomial p-value is 0.000911 for reference. The decision uses the uncorrected p-value of 0.000674, which is at most 0.05, so the result is REJECT.
Reading the result and limitations
A REJECT decision means the two kinds of discordant pairs are unlikely to be equally frequent, which points to a real shift between the paired measurements. DO_NOT_REJECT means the data do not show such a difference at the chosen level. It does not prove equality. The test ignores concordant pairs, so it says nothing about agreement overall. It assumes pairs are independent and that each subject is measured twice on a binary outcome. With few discordant pairs, rely on the exact p-value. The chi-square p-value is an approximation, and the corrected statistic is more conservative.
FAQ
Why do cells a and d not matter?
The test asks whether switches from 0 to 1 are as common as switches from 1 to 0. Pairs that did not change carry no information about that question.
When is the exact test used?
When b + c is 20 or fewer. The chi-square approximation is unreliable for such small totals, so the binomial reference is used.
Should I use the continuity correction?
The correction makes the test more conservative and is often preferred for moderate totals. Both statistics are shown so the two can be compared.
What if b equals c?
The uncorrected statistic is 0 and p = 1. The corrected statistic is still positive, and its p-value is shown as computed.
Is the test one-sided or two-sided?
It is two-sided: the alternative is that the two discordant probabilities differ in either direction.
Sources
- McNemar Test (Dataplot reference manual), NIST Information Technology Laboratory, 2023