What this calculator does
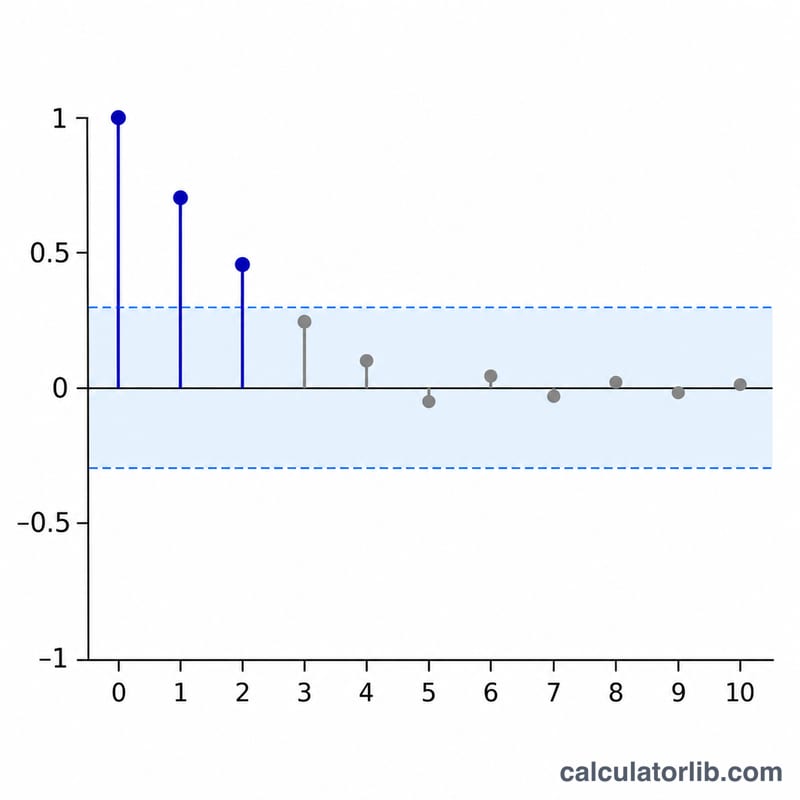
This calculator computes the sample autocorrelation of an ordered data series at a chosen lag k. Autocorrelation measures how strongly each observation relates to the value k steps later. It is used to check randomness, spot trends or cycles in time series, and examine residuals from a fitted model. It also reports the sample size, the mean, an approximate 95% band and a flag showing whether the result exceeds that band.
How to use it
Enter the values in time order in the Data series field, separated by commas, semicolons, spaces or new lines, with a period as the decimal mark. Then enter the integer Lag k, which must be at least 1 and at most N-1. Finally, choose Lags to compute: either only lag k, or every lag from 0 to k. In all-lags mode the lag table lists each lag with its coefficient.
Formula
The lag-k autocorrelation follows the NIST/SEMATECH definition:
$$r_k = \frac{\sum_{i=1}^{N-k}(Y_i - \bar{Y})(Y_{i+k} - \bar{Y})}{\sum_{i=1}^{N}(Y_i - \bar{Y})^2}$$Here \(Y_i\) is the i-th observation, \(N\) is the number of observations, \(k\) is the lag, and \(\bar{Y}\) is the mean of all N values. The approximate 95% band under randomness is:
$$\pm\frac{1.96}{\sqrt{N}}$$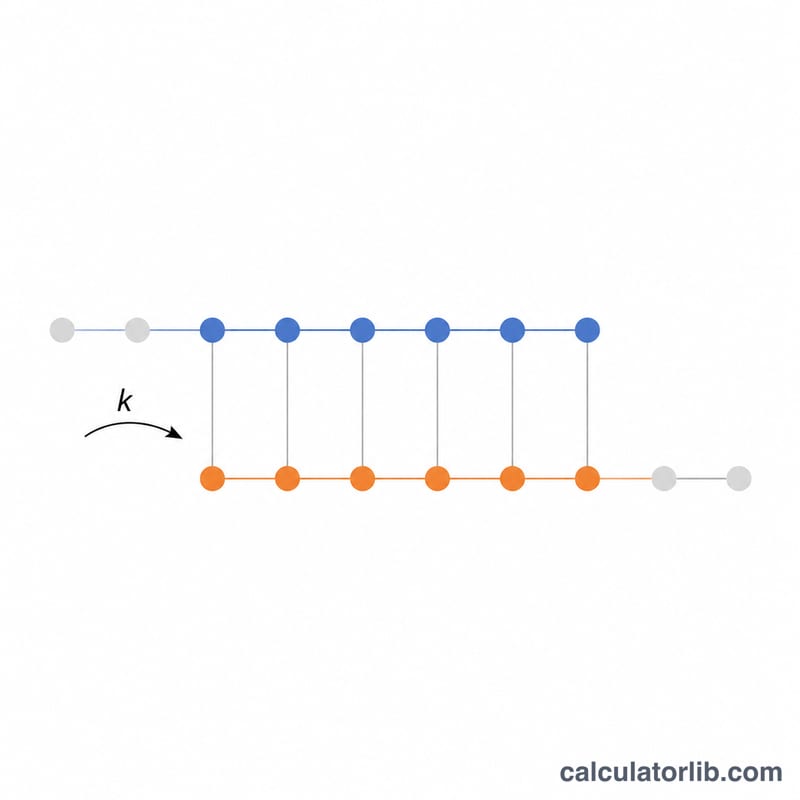
Conventions and assumptions
- The numerator sums products for i = 1 to N-k. The denominator sums squared deviations for i = 1 to N. The mean is that of the full sample, and no N/(N-k) rescaling is applied.
- At lag 0 the coefficient is 1 whenever the variance is non-zero.
- Observations are treated as equally spaced and in the order entered. The time variable is not an input.
- The lag must be an integer from 1 to N-1. All-lags mode returns lags 0 to k.
- The band 1.96/√N uses the standard normal 97.5% quantile. It is a design choice of this calculator, not a value printed in the NIST page. A lag is flagged when |r_k| exceeds the band.
- Calculations use full precision. Display is rounded to 4 decimal places.
Worked example
The series is 3 5 4 6 8 7 9 12 10 11 with k = 1 in single-lag mode. The sample size is \(N = 10\) and the mean is:
$$\bar{Y} = 7.5$$The lag-1 autocorrelation is:
$$r_1 = 0.6091$$The band is:
$$\frac{1.96}{\sqrt{10}} = 0.6198$$Since \(0.6091 < 0.6198\), the result does not exceed the band, so the flag is false. The lag table shows the single line 1: 0.6091.
Reading the result and limitations
Values near +1 mean that high values tend to follow high values and low values follow low values. Values near -1 indicate alternation. Values near 0 suggest little linear dependence at that lag. A coefficient outside the band is unlikely under pure randomness, but the band is approximate and works best with moderately large N. With short series, such as the 10 values above, the estimate is noisy. A strong trend inflates autocorrelation at many lags. Checking many lags at once will also produce some false flags by chance. A constant series is rejected because the denominator is zero.
FAQ
Can r_k be larger than 1?
No. With this definition |r_k| is always at most 1.
Why is lag 0 always 1?
At lag 0 the numerator equals the denominator, so the ratio is 1 when the variance is non-zero.
What is the largest lag allowed?
The lag can be at most N-1. At that lag only one product term is used, so the estimate is very unreliable.
Why is a constant series refused?
All deviations from the mean are zero, so the denominator is zero and autocorrelation is undefined.
Does the calculator use the time stamps?
No. Values are assumed to be equally spaced and are used in the order entered.
Is the 95% band exact?
No. It is an approximation under randomness, based on the normal distribution.