What this calculator does
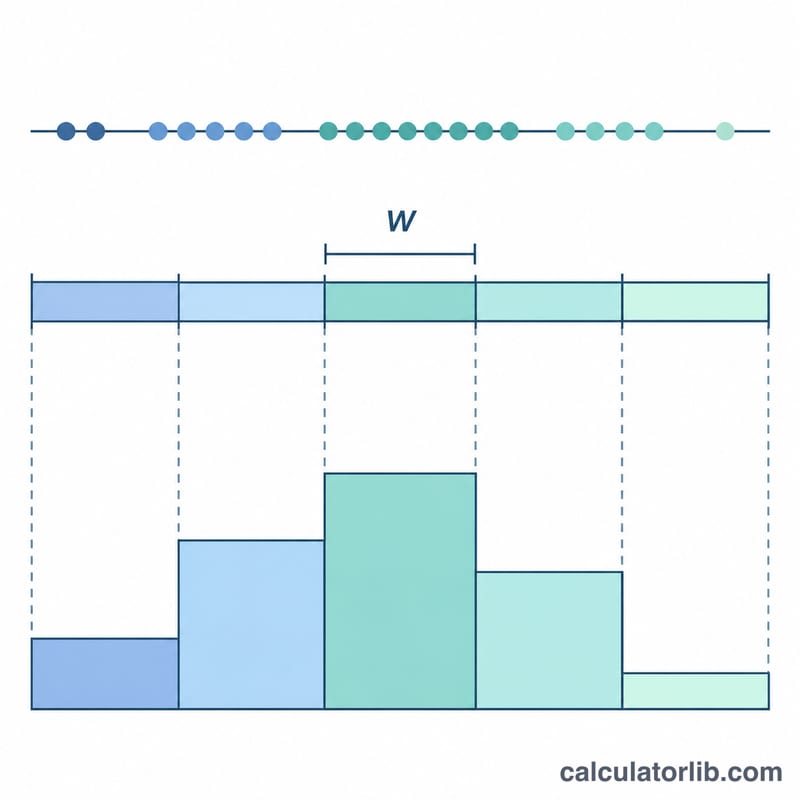
This calculator turns a list of raw numbers into a frequency table of the kind used to draw a histogram. It splits the data range into equal-width bins and reports, for each bin, the count, relative frequency, cumulative count, cumulative relative frequency and density. It suits students, analysts and anyone who needs a quick look at how values are distributed.
How to use it
Enter the inputs in this order:
- Data values: numbers separated by commas, semicolons, spaces or new lines, with a period as the decimal separator.
- Bin rule: automatic (Sturges), number of bins, or bin width.
- Start of first bin: the data minimum, or a manual value.
- Start value: used only for a manual start; it must not exceed the smallest data value.
- Bin width: used only with the bin width rule; it must be greater than 0.
- Number of bins: used only with the number of bins rule; a whole number from 1 to 1000.
Formulas
With \(n\) observations, class count \(c_i\) and bin width \(w\):
$$r_i = \frac{c_i}{n}, \qquad C_i = \sum_{j\le i} c_j, \qquad d_i = \frac{c_i}{n\,w}$$Here \(r_i\) is the relative frequency, \(C_i\) the cumulative count and \(d_i\) the density, so the histogram area equals 1. The cumulative relative frequency is \(C_i/n\). The default number of bins is:
$$k = \lceil \log_2 n \rceil + 1$$For the count and Sturges rules the width is \(w = (\max - \text{start})/k\). For the width rule, \(k = \max(1, \lceil (\max - \text{start})/w \rceil)\).
Conventions and assumptions
- Bins have equal width and cover the data range. The default Sturges rule is a design choice of this tool, not taken from the cited source.
- Each bin is left-closed and right-open, \([lo, hi)\). The last bin is closed, \([lo, hi]\), so the maximum is always counted. A value on an interior edge goes in the upper bin.
- Relative frequency is count divided by n and sums to 1. Density is count divided by \(n w\).
- The cumulative count of a bin is its count plus the counts of all lower bins.
- The start is the data minimum or a manual value that must not exceed the minimum, so no value falls outside the bins.
- If all values are equal, the width would be 0, so it is set to 1. The tool then reports one bin holding every value, whatever bin count was requested.
- Results are computed as raw doubles and rounded only for display: 4 decimals for fractions, 6 significant digits for edges.

Worked example
The data are 2.1, 3.4, 4.8, 5.0, 5.5, 6.7, 7.2, 8.9, 9.4, 10.0, 12.5, 14.1 with the Sturges rule and the data minimum as start. Then \(n = 12\) and:
$$k = \lceil \log_2 12 \rceil + 1 = 4 + 1 = 5, \qquad w = \frac{14.1 - 2.1}{5} = 2.4$$The bins are [2.1, 4.5); [4.5, 6.9); [6.9, 9.3); [9.3, 11.7); [11.7, 14.1].
Counts: 2; 4; 2; 2; 2. Relative frequencies: 0.1667; 0.3333; 0.1667; 0.1667; 0.1667. Cumulative counts: 2; 6; 8; 10; 12. Cumulative relative frequencies: 0.1667; 0.5000; 0.6667; 0.8333; 1.0000. For the density:
$$d_1 = \frac{2}{12 \times 2.4} = 0.0694, \qquad d_2 = \frac{4}{12 \times 2.4} = 0.1389$$The remaining densities are 0.0694 for each of the other three bins.
Reading the result and limitations
Tall bins show where values cluster. The cumulative columns show the share of data at or below each upper edge. The shape of a histogram depends on the bin choice, so try several widths before drawing conclusions. Sturges tends to give few bins for large samples. In width mode with a manual start far below the data, leading bins can be empty. Non-numeric tokens are rejected, and more than 1000 bins is not allowed.

FAQ
What happens when a value sits exactly on a bin edge?
It goes in the upper bin, because bins are left-closed. The only exception is the final edge, which belongs to the last bin.
What if all my values are identical?
The width would be zero, so it is set to 1 and a single bin containing all values is produced, even if you asked for several bins.
Can I use negative numbers?
Yes. Negative values are allowed, and the start value may also be negative as long as it does not exceed the minimum.
Why is the density different from the relative frequency?
Density divides by the bin width as well, so the total area of the bars equals 1. This makes histograms with different widths comparable.
Which bin rule should I choose?
Use bin width when you need round class limits, number of bins for a fixed layout, and Sturges as a quick default for modest sample sizes.