What Is Relative Frequency?
Relative frequency is the proportion of times a particular value or category occurs out of all observations in a data set. Instead of reporting a raw count (the absolute frequency), relative frequency expresses that count as a fraction or percentage of the whole. This makes it easy to compare categories across data sets of different sizes.
How to Use This Calculator
Enter the frequency — how many times the class of interest appears — and the total count of all observations. The calculator divides the two and returns the relative frequency as a decimal and a percentage. For a full frequency distribution, repeat the calculation for each class; all the relative frequencies should add up to 1 (or 100%).
The Formula Explained
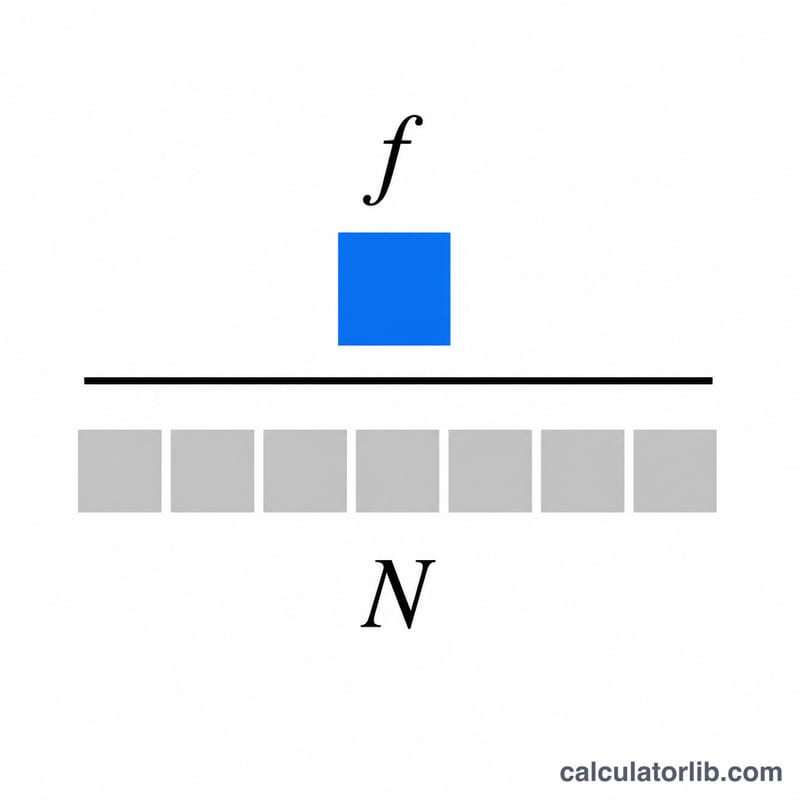
The formula is simply:
$$\text{Relative Frequency} = \frac{f}{N}$$
where f is the frequency of the class and N is the total number of observations. Multiply the result by 100 to convert it to a percentage. Because it is a ratio of a part to a whole, the value always falls between 0 and 1.
Worked Example
Suppose a survey of 50 people finds that 12 prefer tea. The relative frequency of "tea" is \(12 \div 50 = 0.24\), or 24%. If 38 prefer coffee, its relative frequency is \(38 \div 50 = 0.76\) (76%). Notice that \(0.24 + 0.76 = 1.00\), confirming the distribution is complete.
FAQ
What is the difference between frequency and relative frequency? Frequency is the raw count of occurrences; relative frequency is that count divided by the total, giving a proportion.
Can relative frequency be greater than 1? No. Since the frequency can never exceed the total count, the result is always between 0 and 1 (0% to 100%).
How do I turn it into a percentage? Multiply the relative frequency by 100. A relative frequency of 0.24 equals 24%.


