What the Friedman test calculator does
This calculator tests whether k treatments have identical effects when each treatment is measured within each of b blocks (for example subjects, batches or days). It is a rank-based, nonparametric alternative to a repeated-measures ANOVA. It ranks values inside every block, adds the ranks for each treatment, and returns the Friedman statistic T1, the Conover statistic T2, both p-values, the critical value and a reject or do-not-reject decision.
How to use it
Enter the data table with one block per line and one treatment per column. Separate values with commas, semicolons, spaces or tabs, and use a point as the decimal separator. Every line needs the same number of values, with at least 2 blocks and 2 treatments. Then choose the significance level alpha (10%, 5%, 2.5% or 1%) and the reference distribution for the decision: F (Conover T2, the default and preferred option) or chi-square (T1).
Formulas
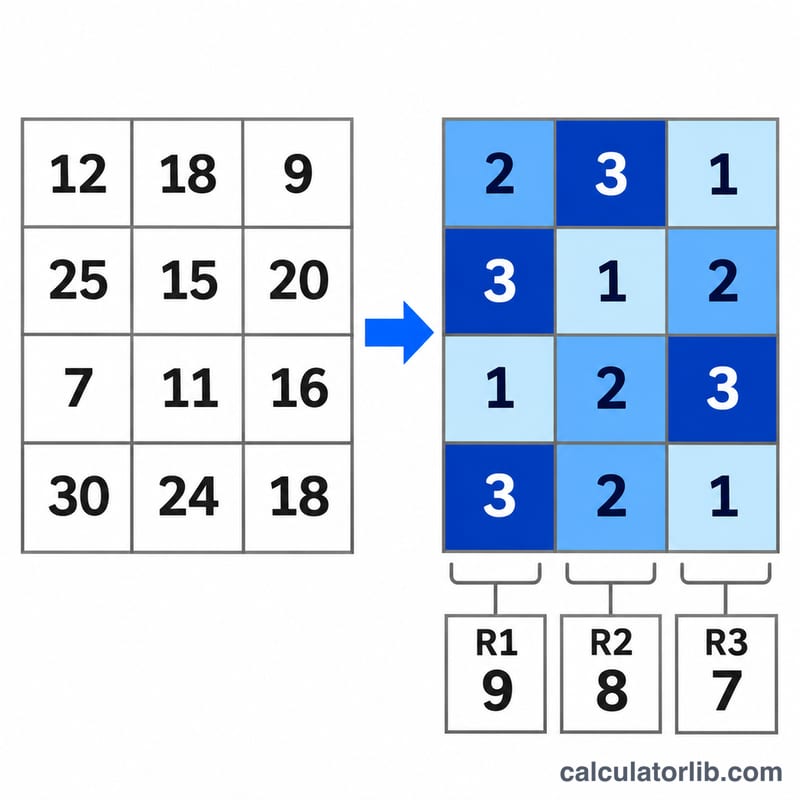
Within each block, values are ranked and \(R_j\) is the sum of the ranks for treatment j.
$$S=\sum_{j=1}^{k}\left(R_j-\frac{b(k+1)}{2}\right)^2$$
$$T_1=\frac{12\,S}{bk(k+1)}\quad\text{(no ties)},\qquad T_1=\frac{(k-1)\,S}{A_1-C_1}\quad\text{(ties)}$$
$$A_1=\sum_i\sum_j R(X_{ij})^2,\qquad C_1=\frac{bk(k+1)^2}{4}$$
$$T_2=\frac{(b-1)\,T_1}{b(k-1)-T_1}$$
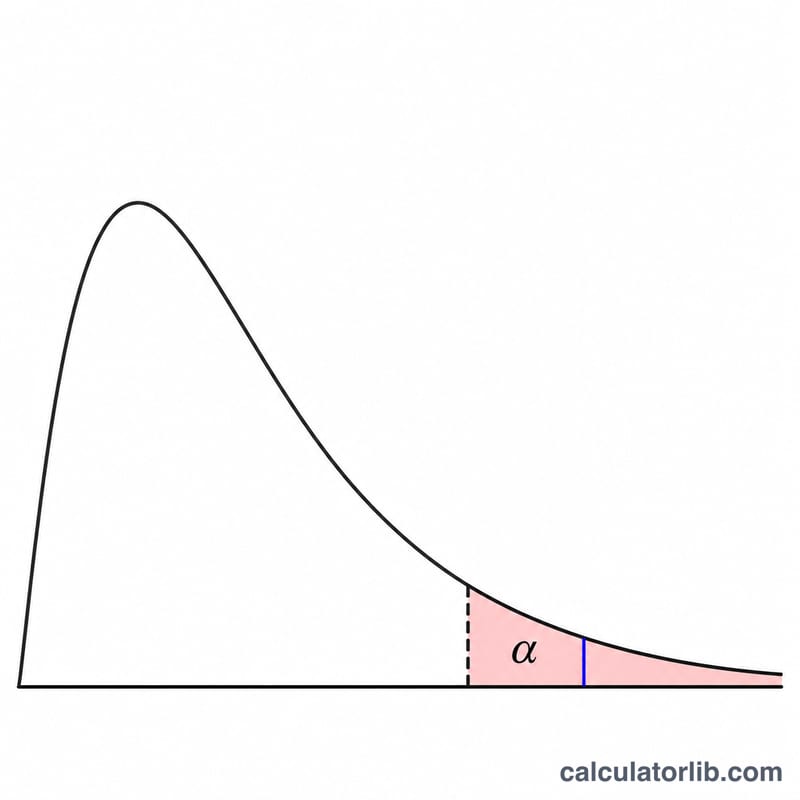
Here \(b\) = number of blocks, \(k\) = number of treatments, \(A_1\) = sum of all squared ranks and \(C_1\) = correction factor. T1 is compared with a chi-square distribution with \(k-1\) degrees of freedom; T2 is compared with an F distribution with \(k-1\) and \((b-1)(k-1)\) degrees of freedom.
Conventions and assumptions
- Ranking is ascending within each block, rank 1 for the smallest value. Tied values get the average of the ranks they span. The direction does not change the statistic.
- If any block has a tie, the tie-corrected T1 is used. Without ties the two forms are identical.
- T2 is the preferred statistic because its F approximation is usually more accurate than the chi-square approximation of T1.
- The p-values are upper-tail probabilities. H0 is rejected only if the statistic is strictly greater than the critical value (p below alpha); equality means do not reject.
- No continuity correction is applied.
- If T1 equals b(k-1), all blocks order the treatments identically, T2 is infinite, the F p-value is 0 and H0 is rejected.
- If all values in every block are equal, the statistic is undefined and an error is returned.
- Multiple comparisons after the test are not included.
Worked example
The data have b = 6 blocks and k = 3 treatments, with alpha = 0.05 and the F reference. The rows are 4 5 3, 6 7 5, 8 6 9, 5 7 4, 7 9 6 and 3 6 5. After ranking inside each row, the rank sums are 11, 16 and 9.
$$A_1=84,\qquad C_1=\frac{6\times 3\times 4^2}{4}=72$$
$$T_1=4.33333,\qquad T_2=\frac{(6-1)\times 4.33333}{6\times 2-4.33333}=2.82609$$
The F p-value with 2 and 10 degrees of freedom is 0.10645, and the critical value is 4.103. The chi-square p-value for T1 is 0.11456. Because 2.82609 is below 4.103 (p = 0.10645 is above 0.05), the decision is do not reject H0.
How to read the result
A small p-value suggests that at least one treatment tends to rank higher or lower than the others within blocks. A large p-value means the data do not show a consistent treatment effect; it does not prove the treatments are equal. The test says nothing about which treatments differ. Small numbers of blocks make the chi-square approximation less reliable, which is one reason T2 is the default. Missing values are not supported, so every block must be complete.
FAQ
When should I use the Friedman test?
Use it when the same units are measured under several conditions and the data are ordinal or not normally distributed, so a repeated-measures ANOVA is not appropriate.
Why are there two p-values?
T1 follows an approximate chi-square distribution, while T2 follows an approximate F distribution that is generally more accurate. The decision uses the one you select.
How are ties handled?
Tied values share the average of their ranks, and T1 switches to the tie-corrected form.
Does the ranking direction matter?
No. Ranking in descending order gives the same statistic.
What does an infinite T2 mean?
It occurs when every block ranks the treatments in the same order. The F p-value is then 0 and H0 is rejected.
Sources
- Dataplot FRIEDMAN TEST, NIST/ITL, 2023