What the sign test calculator does
This calculator runs an exact sign test on one sample or on paired data. It compares each observation with a hypothesized value, counts how many differences are positive and how many are negative, and returns an exact binomial p-value. It suits small samples, ordinal data, or cases where a normal assumption is doubtful, and it asks only whether values tend to fall above or below the hypothesized value.
How to use it
Choose the test type: one sample or paired two sample. Pick the alternative hypothesis: two-sided, lower-tailed (fewer positives) or upper-tailed (more positives). Enter the sample 1 values, separated by commas, semicolons, spaces or new lines. For a paired test, enter sample 2 with the same count and in the same order; it is ignored for a one-sample test. Enter the hypothesized value d0 (a median or mean for one sample, a difference for paired data). Finally set alpha, usually 0.05. Up to 1000 values are supported.
The formula
Differences are formed first. For a paired test:
$$d_i = x_i - y_i - d_0$$For one sample, \(d_i = x_i - d_0\). Let \(R_+\) be the number of \(d_i > 0\), \(R_-\) the number of \(d_i < 0\), and \(N = R_+ + R_-\). The statistics are binomial cumulative probabilities with \(p = 0.5\):
$$S_+ = \sum_{j=0}^{R_+} \binom{N}{j}2^{-N},\quad S_- = \sum_{j=0}^{R_-} \binom{N}{j}2^{-N}$$The p-value is \(S_+\) for the lower tail, \(S_-\) for the upper tail, and for the two-sided case:
$$p = \min(1,\ 2\min(S_+, S_-))$$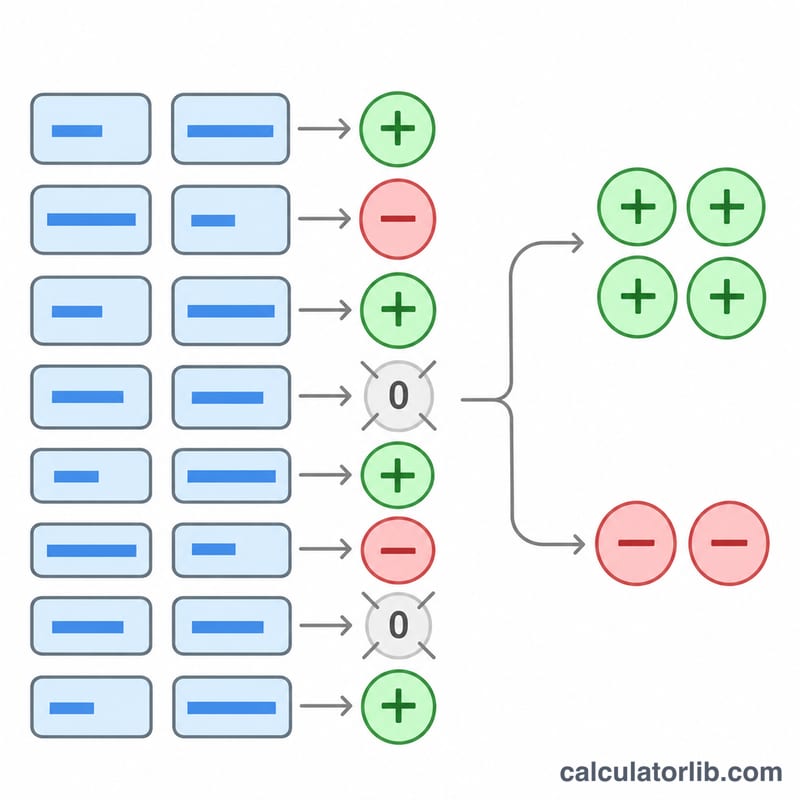
Conventions and assumptions
Differences equal to zero are ties and are excluded, so \(N = R_+ + R_-\). Because subtraction in floating point can leave tiny residues, a difference counts as zero when its absolute value is below \(10^{-12}\). The two-sided p-value doubles the smaller tail and caps the result at 1; this doubling rule is a design choice, since the NIST page does not print it, though it matches the published lower and upper outputs. No normal approximation or continuity correction is offered; only the exact binomial value is computed. H0 is rejected when the selected p-value is at most alpha. The binomial distribution is discrete, so the achieved significance level is generally not exactly alpha. If every difference is a tie, the test cannot be computed.
Worked example
One-sample test with sample 141, 138, 144, 139, 145, 137, 142, 146, 140, 143, hypothesized value \(d_0 = 140\), two-sided, \(\alpha = 0.05\). The differences give \(R_+ = 6\), \(R_- = 3\) and one tie (the value 140), so \(N = 9\).
$$S_+ = 0.91015625,\quad S_- = 0.25390625$$$$p = \min(1,\ 2 \times 0.25390625) = 0.5078125$$Since \(0.5078 > 0.05\), H0 is not rejected.
How to read the result
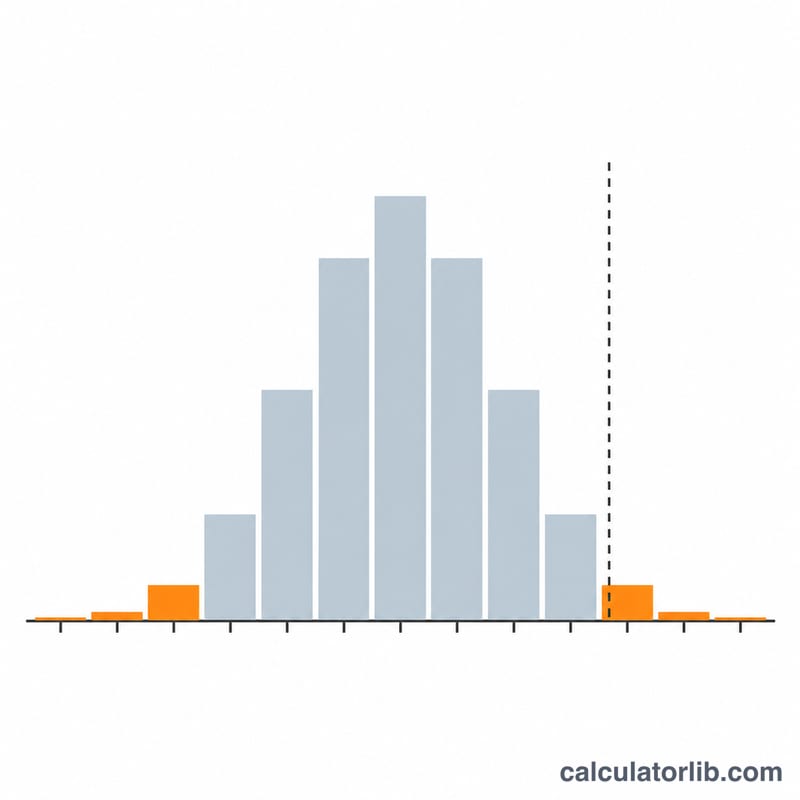
A small p-value means the split between positive and negative differences is unlikely if positives and negatives were equally probable. A large p-value, as above, means the data do not show a consistent direction. The test ignores the size of differences, so it has less power than tests that use magnitudes. Dropping ties reduces N and therefore power. Not rejecting H0 is not proof that it is true.
FAQ
What does the sign test assume?
Observations are independent, and each difference is either above or below the hypothesized value. Under H0 the number of positive signs follows a Binomial(N, 0.5) distribution.
Why are ties dropped?
A zero difference carries no direction. Following the NIST Dataplot convention, ties are excluded and the effective sample size is reduced.
When should I use the paired option?
Use it for before and after measurements or matched pairs. The calculator subtracts sample 2 from sample 1 and then subtracts d0.
Why is the two-sided p-value sometimes 1?
Doubling the smaller tail can exceed 1 when the signs are nearly balanced, so it is capped at 1.
Is a normal approximation used for large samples?
No. The exact binomial sum is computed for any N up to 1000.
Sources
- Dataplot SIGN TEST command, NIST/SEMATECH Dataplot, 2023