What is the Crypto DCA Calculator?
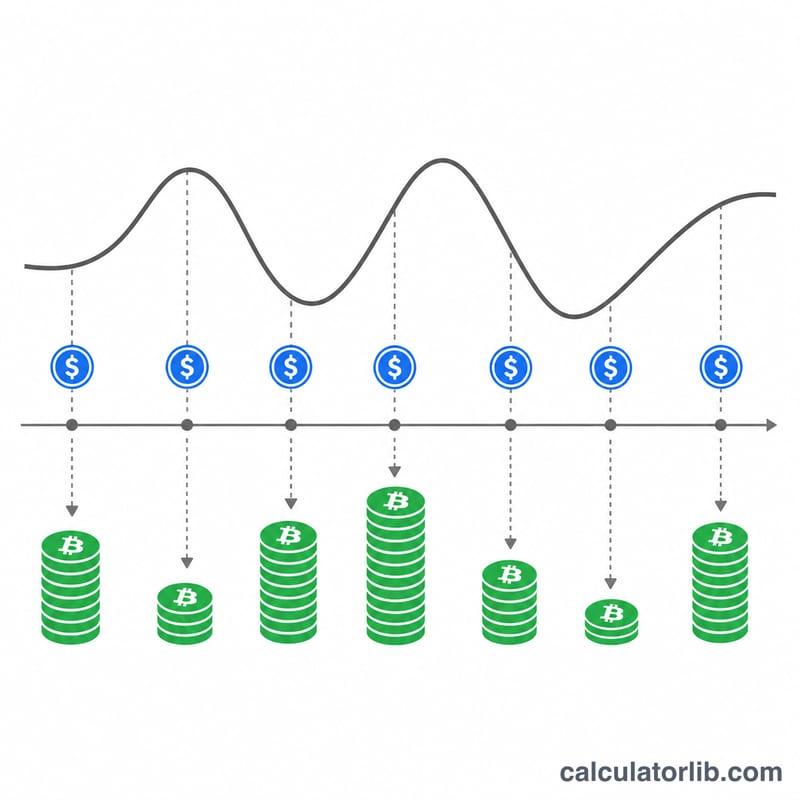
Dollar-cost averaging (DCA) is an investing strategy where you buy a fixed dollar amount of an asset at regular intervals, regardless of price. This calculator models a crypto DCA plan: it accumulates coins period by period at the prevailing price, then values your holdings at a current price so you can see total coins, average cost, profit and return on investment.
How to use it
Enter the amount you invest each period, the number of periods, the asset price at the start and end of your buying window, and the current price you want to value the portfolio at. The tool assumes the price moves linearly between the start and end price across your periods, buying more coins when prices are low and fewer when prices are high — the core benefit of DCA.
The formula explained
For each period i you receive \(\text{Invest} / P_i\) coins. Summing across all periods gives total coins. Your average cost per coin equals total invested divided by total coins. Portfolio value is total coins multiplied by the current price, and ROI is profit divided by total invested.
$$\begin{gathered} \text{ROI} = \frac{N \cdot C - I}{I} \times 100\% \\[1.5em] \text{where}\quad \left\{ \begin{aligned} N &= \sum_{i=0}^{n-1} \frac{\text{Contribution}}{P_i} \\ P_i &= \text{Start Price} + \left(\text{End Price} - \text{Start Price}\right)\frac{i}{n-1} \\ C &= \text{Current Price} \\ I &= \text{Contribution} \cdot \text{Periods} \\ n &= \text{Periods} \end{aligned} \right. \end{gathered}$$
Worked example
Suppose you invest $100 per period for 12 periods while the price rises from $20,000 to $40,000. Because each period buys a different number of coins, your average cost lands below the simple midpoint. If the current price is $40,000, the calculator shows your accumulated coins, the $1,200 invested, your average cost, and the resulting profit and ROI.
FAQ
Does this account for fees or taxes? No — results are gross of trading fees, spreads and taxes, which vary by exchange and jurisdiction.
Why does it assume a linear price path? Real prices are volatile, but a linear path between start and end prices is a simple, transparent way to illustrate how DCA averages your entry. Actual results depend on the real price at each buy.
Can I use this for stocks or any asset? Yes. The math works for any asset you buy a fixed amount of on a schedule, not just crypto.