
What is Dollar-Cost Averaging?
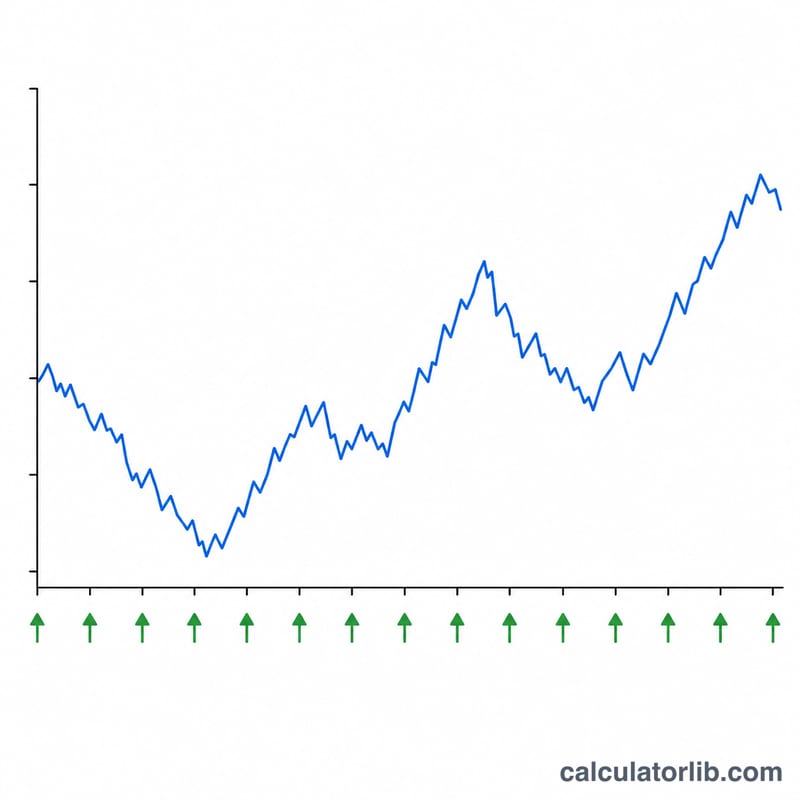
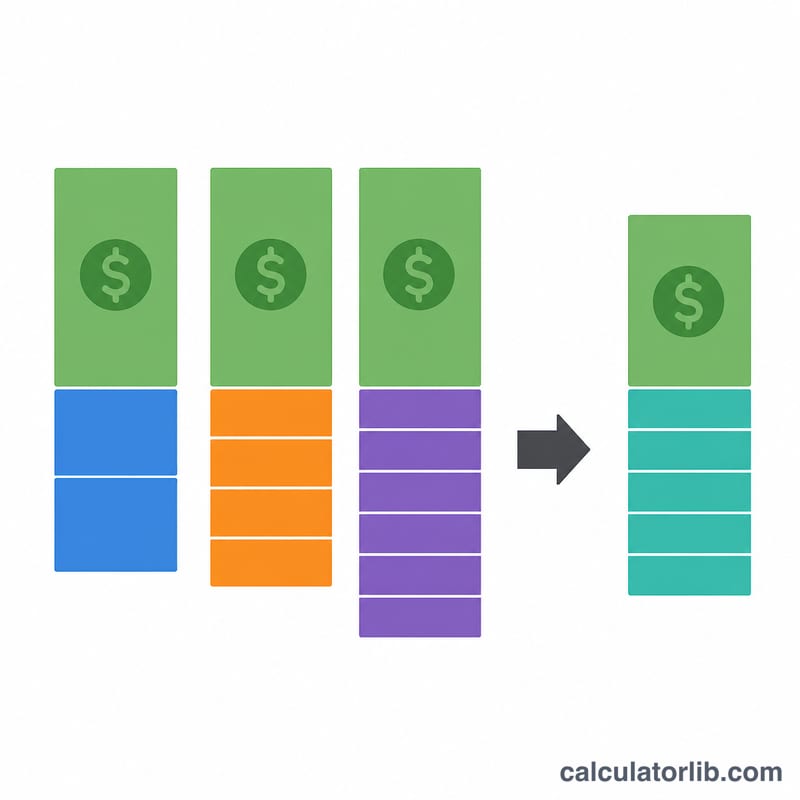
Dollar-cost averaging (DCA) is an investing strategy where you invest a fixed amount of money at regular intervals — for example, $100 every month — regardless of the asset's price. When the price is low your fixed dollars buy more shares, and when the price is high they buy fewer. Over time this smooths out volatility and produces an average cost per share that is typically lower than the simple average of the prices you paid.
How to use this calculator
Enter the fixed amount you invest each period, the number of periods, and the share price for each period as a comma-separated list. The calculator buys shares at each price, sums the total shares and total dollars invested, and divides to find your true average cost per share. It also shows the simple mean of the prices so you can see the DCA advantage.
The formula explained
The average cost per share is total invested divided by total shares bought:
$$\text{Average Cost} = \frac{\text{Total Invested}}{\text{Total Shares}} = \frac{\text{Amount} \times N}{\displaystyle\sum_{i=1}^{N} \frac{\text{Amount}}{P_i}}$$Because shares bought in a period equal that period's investment divided by its price, periods with cheaper prices contribute more shares — pulling your average cost below the arithmetic mean of prices. This is the harmonic-mean effect that makes DCA attractive.
Worked example
Invest $100 over 4 periods at prices $10, $12.50, $8, and $11. Shares bought: \(10 + 8 + 12.5 + 9.0909 = 39.5909\). Total invested = $400. Average cost =
$$\frac{400}{39.5909} = \$10.10$$lower than the simple mean of $10.375.
FAQ
Why is my average cost lower than the average price? Because fixed dollars buy more shares when prices are low, weighting your average toward cheaper purchases.
Does this account for fees or dividends? No — it models clean periodic purchases. Add fees to your per-period amount if you want to include them.
What if the number of prices differs from the periods? The calculator counts every valid price you enter, so make sure your list matches your intended periods.