
What is the False Positive Paradox?
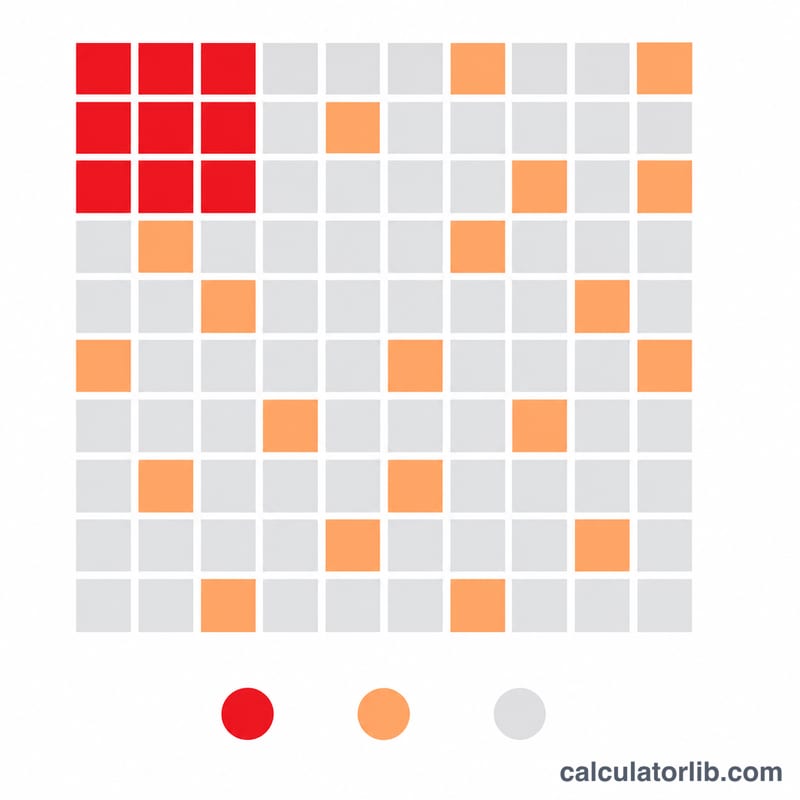
The false positive paradox describes a counter‑intuitive truth in medical testing and screening: even a highly accurate test can produce mostly false alarms when the condition it screens for is rare. This calculator applies Bayes' theorem to reveal the actual probability that you have a disease after testing positive — the positive predictive value (PPV) — which is often far lower than the test's headline accuracy suggests.
How to use it
Enter three percentages: the prevalence (how common the condition is in the tested population), the sensitivity (the chance a sick person tests positive, i.e. the true positive rate), and the specificity (the chance a healthy person tests negative, i.e. the true negative rate). The calculator returns the probability that a positive result is genuine, plus the false discovery rate.
The formula explained
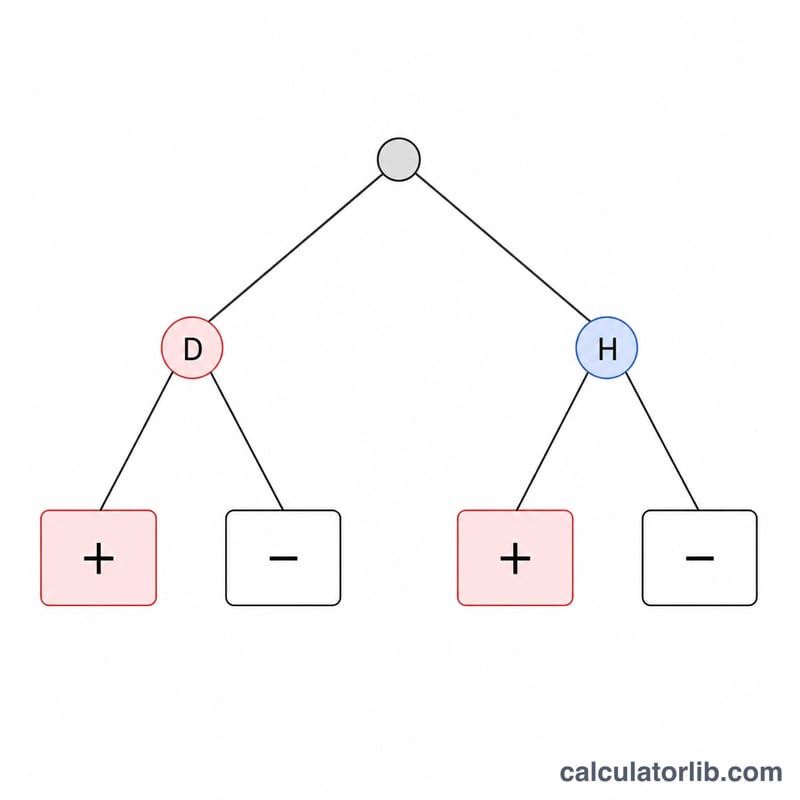
Bayes' theorem combines how likely sick people are to test positive with how likely healthy people are to test positive by mistake:
$$P(D|+) = \frac{\text{sens} \times \text{prev}}{\text{sens} \times \text{prev} + (1 - \text{spec}) \times (1 - \text{prev})}$$The numerator is the fraction of the population that is both sick and correctly flagged. The denominator adds the false positives — healthy people incorrectly flagged. When prevalence is tiny, that false‑positive term dominates.
Worked example
Suppose a disease affects 1% of people (prevalence = 0.01), the test has 99% sensitivity and 95% specificity. True positives = \(0.99 \times 0.01 = 0.0099\). False positives = \(0.05 \times 0.99 = 0.0495\). PPV = \(0.0099 \div (0.0099 + 0.0495) = 0.0099 \div 0.0594 \approx 16.7\%\). So despite a "99% accurate" test, only about 1 in 6 positive results is real.
FAQ
Why is the probability so low? Because rare conditions mean there are far more healthy people, so even a small false‑positive rate generates many more false alarms than true positives.
How can I increase the PPV? Test higher‑risk groups (higher prevalence), use more specific tests, or confirm with a second independent test.
Is this only for medical tests? No — the same Bayesian logic applies to spam filters, fraud detection, drug screening and any rare‑event classifier.