
What This Calculator Does
This tool calculates the availability (uptime percentage) of a system, server, or network component from two reliability metrics: MTBF (Mean Time Between Failures) and MTTR (Mean Time To Repair). It is a universal reliability-engineering formula used across IT, telecom, manufacturing, and data-center operations to express how often a system is "up" and ready to serve.
How to Use It
Enter the average operating time between failures (MTBF) and the average time it takes to restore service after a failure (MTTR), both in the same time unit (hours work well). The calculator returns availability as a percentage, the complementary downtime percentage, and the estimated downtime hours per year assuming a 8,760-hour year.
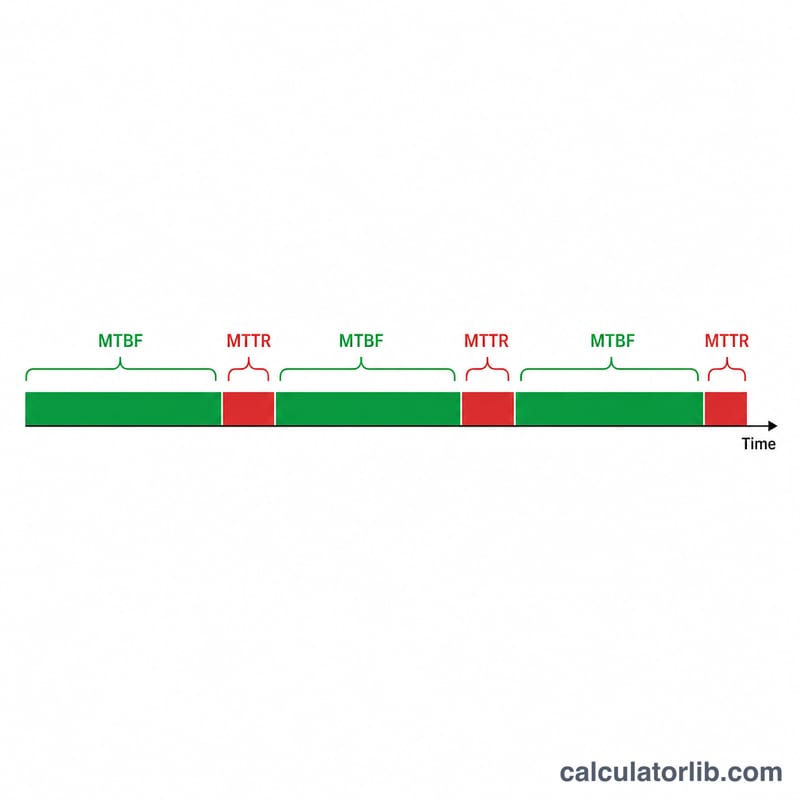
The Formula Explained
Availability is the fraction of total time a system is operational: Availability = MTBF / (MTBF + MTTR) × 100.
$$\text{Availability} = \frac{\text{MTBF (hours)}}{\text{MTBF (hours)} + \text{MTTR (hours)}} \times 100\%$$A high MTBF (failures are rare) and a low MTTR (repairs are fast) both push availability toward 100%. The denominator represents the full failure-and-repair cycle, so the formula simply measures the share of that cycle spent running.
Worked Example
Suppose a router has an MTBF of 1,000 hours and an MTTR of 4 hours.
$$\text{Availability} = \frac{1000}{1000 + 4} \times 100 = 99.6016\%$$Downtime is 0.3984%, which over a year (8,760 hours) equals about 34.9 hours of outage. To reach the famous "five nines" (99.999%) you would need to cut repair time dramatically or raise MTBF.
Availability Tiers and Allowed Downtime (The Nines)
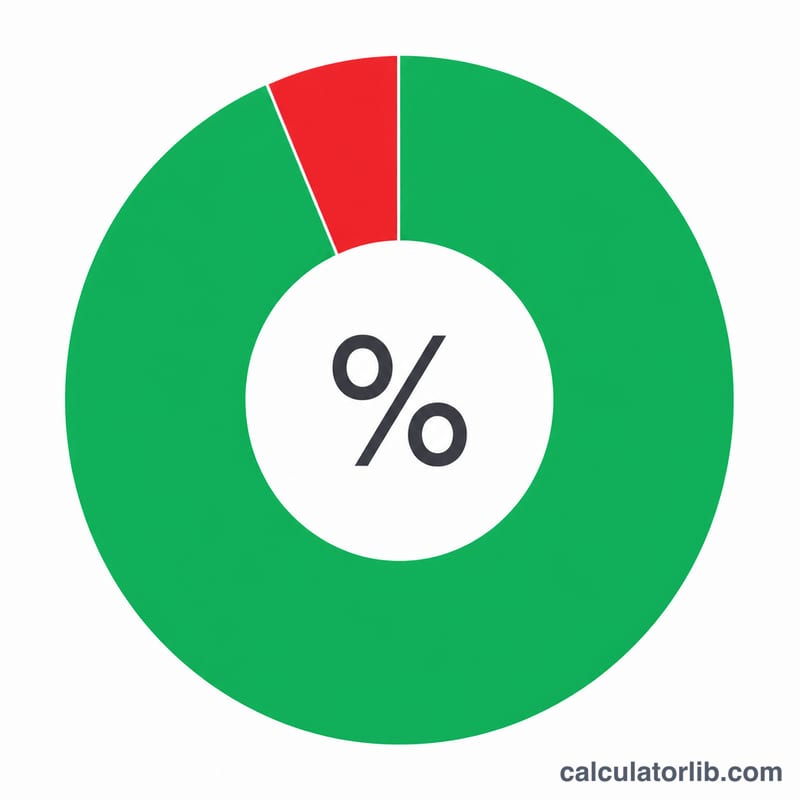
Availability is often described by the number of nines. Allowed downtime is \((1 - A) \times\) the period. The table uses an 8,760-hour year (365 days), an average month of 43,800 minutes (730 hours), and a 24-hour day.
| Availability | Common name | Downtime per year | Downtime per month (avg) | Downtime per day |
|---|---|---|---|---|
| 99% | Two nines | 87.6 hours | 7.3 hours | 14.4 minutes |
| 99.9% | Three nines | 8.76 hours | 43.8 minutes | 1.44 minutes (86.4 s) |
| 99.95% | Three and a half nines | 4.38 hours | 21.9 minutes | 43.2 seconds |
| 99.99% | Four nines | 52.56 minutes | 4.38 minutes | 8.64 seconds |
| 99.999% | Five nines | 5.26 minutes | 26.3 seconds | 0.864 seconds |
| 99.9999% | Six nines | 31.5 seconds | 2.63 seconds | 0.086 seconds |
Each extra nine cuts allowed downtime by a factor of ten. For example, 99.9% gives \(0.001 \times 8{,}760 = 8.76\) hours per year.
Scenario Comparison: MTBF vs MTTR Trade-offs
Availability is \(A = \frac{ \text{MTBF} }{ \text{MTBF} + \text{MTTR} }\). Annual downtime is \((1 - A) \times 8{,}760\) hours.
| Scenario | MTBF (h) | MTTR (h) | Availability | Downtime per year (h) |
|---|---|---|---|---|
| Baseline | 1,000 | 4 | 99.60% | ≈ 34.90 |
| Faster repair | 1,000 | 1 | 99.90% | ≈ 8.75 |
| More reliable hardware | 10,000 | 4 | 99.96% | ≈ 3.50 |
| Reliable and fast repair | 10,000 | 0.5 | 99.995% | ≈ 0.44 (about 26 min) |
| Fragile, slow repair | 500 | 8 | 98.43% | ≈ 137.95 |
Worked check for the baseline: \(A = \frac{1000}{1000 + 4} = \frac{1000}{1004} = 0.99602\), so about 99.60%, and downtime is \(8{,}760 \times \frac{4}{1004} \approx 34.90\) hours.
Cutting MTTR from 4 h to 1 h gives the same availability gain as roughly quadrupling MTBF. Repair speed is often the cheaper lever, through monitoring, spares and automation.
Interpreting Your Availability Result
- Steady-state average: The result is a long-run average fraction of time the system is up. It does not say when outages happen. A 99.9% system might have one 8-hour outage in a year or hundreds of short ones.
- SLA tiers: Service level agreements are usually written in nines (see the table above). Check how the provider measures the period (monthly or annual), what counts as downtime, and whether planned maintenance is excluded.
- Series systems: If every component must work, multiply availabilities: \(A_{total} = A_1 \times A_2\). Two 99.9% components in series give \(0.999 \times 0.999 = 0.998001\), or about 99.80%.
- Redundant (parallel) systems: If either component is enough, \(A_{total} = 1 - (1 - A_1)(1 - A_2)\). Two 99.9% components give \(1 - 0.001 \times 0.001 = 0.999999\), or 99.9999%. This assumes independent failures and perfect failover. Shared power, software bugs or a common configuration can reduce the real figure.
- Inherent vs operational availability: The formula here gives inherent availability, \(\frac{ \text{MTBF} }{ \text{MTBF} + \text{MTTR} }\), which counts only failures and repairs. Operational availability also includes planned maintenance, logistics and administrative delays, so it is usually lower.
- Data quality: The output is only as good as the inputs. Vendor MTBF figures are often predictions under ideal conditions, and MTTR should include detection, diagnosis, travel and restoration time, not just the repair itself. Use measured field data where possible.
FAQ
Is "five nines" hard to achieve? Yes — 99.999% availability allows only about 5.26 minutes of downtime per year, demanding redundancy and very fast recovery.
Can MTBF and MTTR use different units? No. Use the same unit for both (e.g. hours) so the ratio is dimensionless.
Does this include planned maintenance? Basic availability uses unplanned repairs only; include planned outages in MTTR if you want operational availability.