What is the Pakistan Income Tax Calculator?
This tool applies to Pakistan only and uses the Federal Board of Revenue (FBR) progressive slab rates for Tax Year 2027. It estimates the annual income tax payable by resident individuals on taxable income, for both salaried persons (where salary is more than 75% of total income) and non-salaried / business individuals. Figures are estimates for planning only and ignore rebates and special credits (the 10% surcharge on non-salaried income above PKR 10 million is included).
How to use it
Choose your employment type, enter your annual taxable income in PKR, and pick whether you want the tax shown per year or per month. The calculator finds the slab your income falls into and returns the tax, net (after-tax) income, your marginal rate, and your overall effective rate.
The formula explained
Pakistan uses a marginal-slab system. For each slab a fixed amount covers all tax due up to the slab's lower limit, then a marginal rate applies only to the income above that limit:
$$\text{Tax} = F + \left(\text{Income} - L\right) \times r$$
For salaried individuals in Tax Year 2027 the slabs are: up to 600,000 → 0%; 600,001–1,200,000 → 1%; 1,200,001–2,200,000 → 11% (+6,000); 2,200,001–3,200,000 → 20% (+116,000); 3,200,001–4,100,000 → 25% (+316,000); 4,100,001–5,600,000 → 29% (+541,000); 5,600,001–7,000,000 → 32% (+976,000); above 7,000,000 → 35% (+1,424,000). Salaried individuals pay no surcharge; for non-salaried individuals a 10% surcharge on the tax applies when taxable income exceeds PKR 10,000,000.
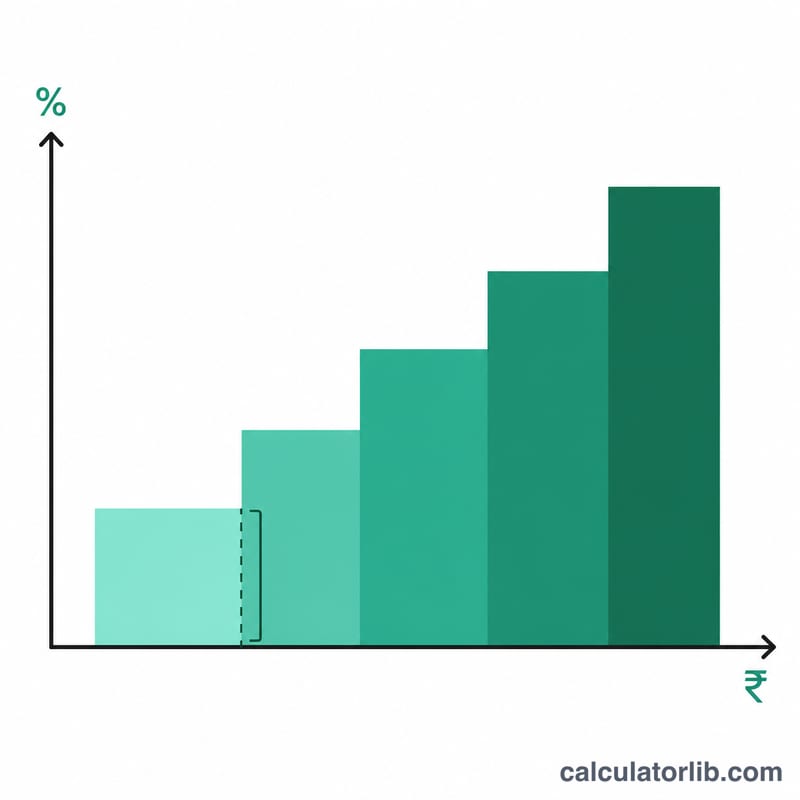
Slabs: FBR Tax Year 2027, Income Tax Ordinance 2001, First Schedule, Part I, Division I (salaried table as substituted by the Finance Act 2026). Salaried: 0% to 600,000; 1%; 11%; 20%; 25%; 29%; 32%; 35% above 7,000,000, no surcharge. Non-salaried: 0%; 15%; 20%; 30%; 40%; 45% above 5,600,000, plus a 10% surcharge when taxable income exceeds 10 million.
Worked example
A salaried person earns PKR 2,500,000. This falls in the 20% slab with a lower limit of 2,200,000 and fixed amount 116,000. $$\text{Tax} = 116{,}000 + (2{,}500{,}000 - 2{,}200{,}000) \times 0.20 = 116{,}000 + 60{,}000 = \textbf{PKR } 176{,}000$$ The effective rate is \(176{,}000 / 2{,}500{,}000 = 7.04\%\).
Income and jobs: Pakistan
Average income and unemployment in Pakistan compared with the world, from the World Bank: a benchmark for the figures you enter above.
- GNI per capita 2025
- 1,500 USD
- GDP per capita, PPP 2025
- 6,573 intl. $
- World: 25,704
- Unemployment 2025
- 5.4%
- World: 4.8%
Latest change Up +4.9% 2025: 1,500 USD, against 1,430 USD in 2024. CalculatorLib computes this change from the two published figures.
In 2025, gross national income per person in Pakistan was 1,500 US dollars a year, about 125 US dollars a month. World: 14,244 USD
| Year | GNI per capita (USD) | GDP per capita, PPP (intl. $) | Unemployment |
|---|---|---|---|
| 2025 | 1,500 | 6,573 | 5.4% |
| 2024 | 1,430 | 6,263 | 5.5% |
| 2023 | 1,450 | 6,019 | 5.2% |
| 2022 | 1,510 | 5,919 | 5.3% |
| 2021 | 1,420 | 5,367 | 6.3% |
| 2020 | 1,370 | 5,048 | 6.0% |
| 2019 | 1,520 | 5,038 | 4.8% |
| 2018 | 1,560 | 4,979 | 4.1% |
| 2017 | 1,450 | 4,790 | 3.2% |
| 2016 | 1,360 | 4,631 | 2.3% |
GNI per capita (Atlas method) is the average of all income in the economy, not a typical salary; PPP dollars adjust for local prices.
Pakistan and other countries
GNI per capita in current US dollars (Atlas method) — each country’s latest published year.
- United States 88,810 USD (2025)
- France 48,630 USD (2025)
- Japan 38,340 USD (2025)
- South Korea 37,880 USD (2025)
- Saudi Arabia 36,070 USD (2025)
- Türkiye 16,300 USD (2025)
- Russia 15,960 USD (2025)
- World 14,244 USD (2025)
- China 14,230 USD (2025)
- Mexico 13,730 USD (2025)
- Vietnam 4,970 USD (2025)
- India 2,760 USD (2025)
- Pakistan 1,500 USD (2025)
Years can differ between rows: each figure is shown with its own year. The same World Bank indicator for every country.
Latest figure: 2025 Data last updated 2026-10-18 · current
Source: The World Bank Group CC BY 4.0
Monthly figures are computed by CalculatorLib from these data.
Source details and methodology
- The World Bank Group — World Development Indicators (NY.GNP.PCAP.CD, NY.GDP.PCAP.PP.CD, SL.UEM.TOTL.ZS)
FAQ
Salaried vs non-salaried — which applies? If salary makes up more than 75% of your total taxable income, use the salaried rates; otherwise use non-salaried/business rates.
Is this exactly what I'll pay? No. It is an estimate of normal income tax under the slab schedule and does not include tax credits, withholding adjustments or minimum tax.
Which tax year is used? The slabs reflect FBR Tax Year 2027 (1 July 2026 – 30 June 2027); the salaried table is the one substituted by the Finance Act 2026.