What this calculator does
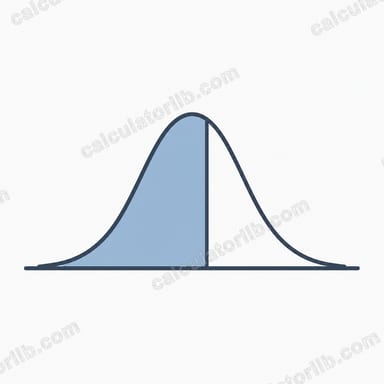
This calculator shows where a measurement falls within the distribution of adult men. Choose erect or flaccid girth or length, enter your value in centimeters or inches, and you get a percentile, a z-score and the share of men who measure larger. The default example is an erect girth of 13 cm.
Data and assumptions
The reference values come from the 2015 systematic review by Veale and colleagues in BJU International, which pooled measurements taken by health professionals on over 15,000 men. Means and standard deviations used (in cm): erect girth 11.66 and 1.10; flaccid girth 9.31 and 0.90; erect length 13.12 and 1.66; flaccid length 9.16 and 1.57. The calculator assumes sizes follow a normal distribution, which is a reasonable approximation but not exact in the extreme tails. Self-measured values tend to run higher than clinician-measured ones, so your percentile may look more flattering than it really is.
How to use it
Select the measurement type, type your value and pick the unit. Girth is the circumference around the shaft, usually measured at mid-shaft. Length is usually measured along the top from the pubic bone to the tip. Inches are converted to centimeters before the calculation.
The formula explained
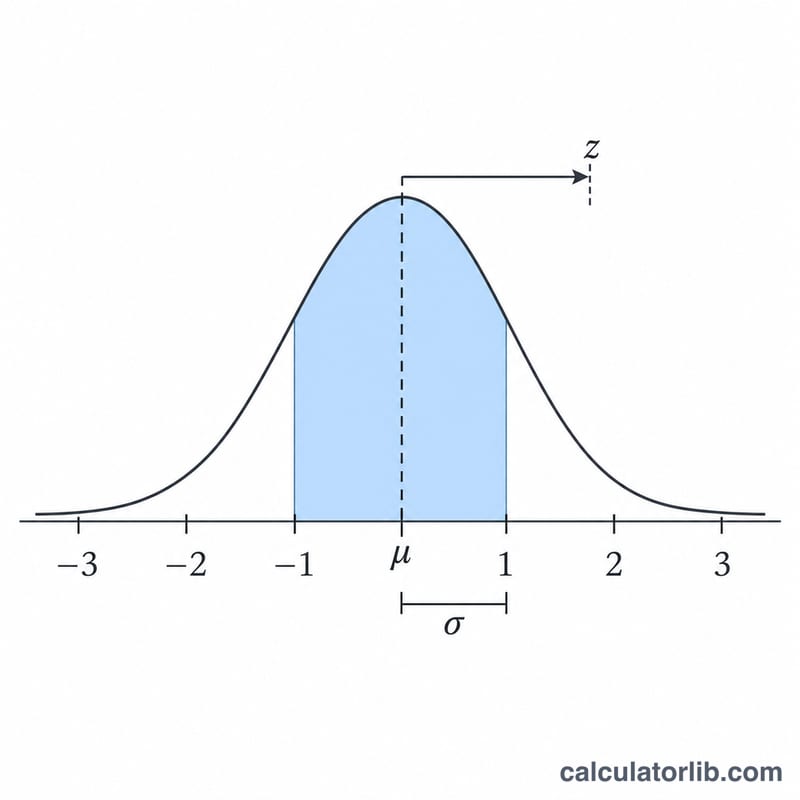
First the measurement is standardised into a z-score, where \(x\) is your value, \(\mu\) the mean and \(\sigma\) the standard deviation:
$$z = \frac{x - \mu}{\sigma}$$The percentile is then the normal cumulative probability:
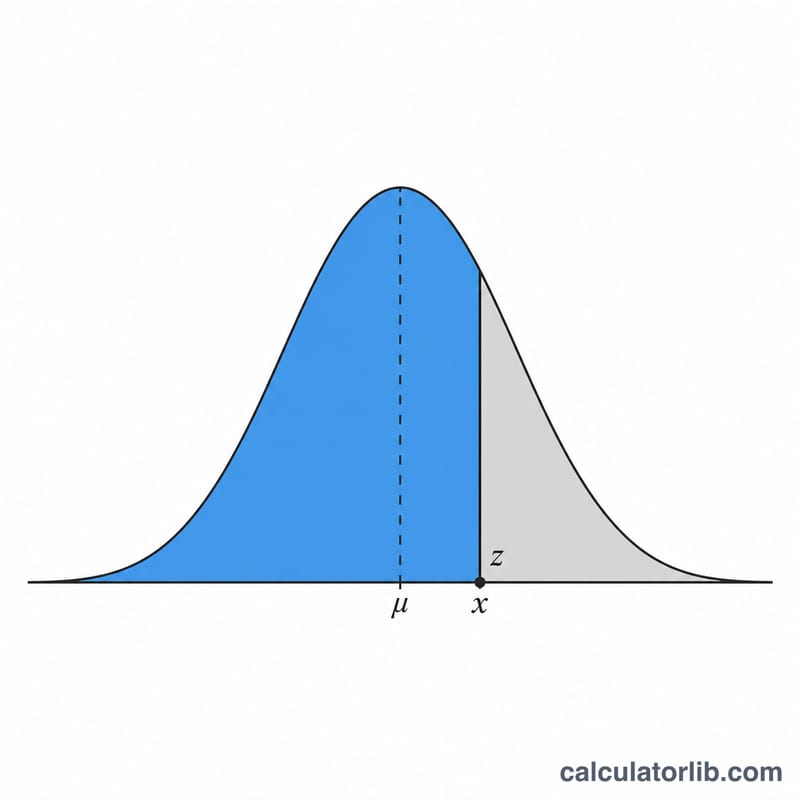
$$P = 100 \times \Phi(z)$$Worked example
For an erect girth of 13 cm, with \(\mu = 11.66\) cm and \(\sigma = 1.10\) cm:
$$z = \frac{13 - 11.66}{1.10} = 1.218$$Looking up the normal curve gives \(\Phi(1.218) \approx 0.888\), so the percentile is about 88.8. Roughly 11 percent of men would be larger.
Percentile Cutoffs by Measurement Type
These cutoffs come from the means and standard deviations reported in Veale et al. (2015), a systematic review and nomogram study. Each value is computed as \(x = \mu + z\sigma\), with z = −1.645, −1.282, −0.674, 0, 0.674, 1.282 and 1.645 for the 5th, 10th, 25th, 50th, 75th, 90th and 95th percentiles. The values assume a normal distribution, which is an approximation. Real data can be skewed, especially in the tails. Inches are cm ÷ 2.54, and all values are rounded.
| Measurement (mean / SD, cm) | 5th | 10th | 25th | 50th | 75th | 90th | 95th |
|---|---|---|---|---|---|---|---|
| Erect girth (11.66 / 1.10) | 9.85 cm (3.88 in) | 10.25 cm (4.04 in) | 10.92 cm (4.30 in) | 11.66 cm (4.59 in) | 12.40 cm (4.88 in) | 13.07 cm (5.15 in) | 13.47 cm (5.30 in) |
| Flaccid girth (9.31 / 0.90) | 7.83 cm (3.08 in) | 8.16 cm (3.21 in) | 8.70 cm (3.43 in) | 9.31 cm (3.67 in) | 9.92 cm (3.90 in) | 10.46 cm (4.12 in) | 10.79 cm (4.25 in) |
| Erect length (13.12 / 1.66) | 10.39 cm (4.09 in) | 10.99 cm (4.33 in) | 12.00 cm (4.72 in) | 13.12 cm (5.17 in) | 14.24 cm (5.61 in) | 15.25 cm (6.00 in) | 15.85 cm (6.24 in) |
| Flaccid length (9.16 / 1.57) | 6.58 cm (2.59 in) | 7.15 cm (2.81 in) | 8.10 cm (3.19 in) | 9.16 cm (3.61 in) | 10.22 cm (4.02 in) | 11.17 cm (4.40 in) | 11.74 cm (4.62 in) |
Measurement method matters. Results vary with technique, such as bone-pressed erect length, and with whether the data were self-reported or taken by a clinician.
More Worked Examples
Example 1: Erect length entered in inches
Suppose erect length is 5.5 in. The reference values are mean 13.12 cm and SD 1.66 cm.
- Convert to cm: \(x = 5.5 \times 2.54 = 13.97\) cm.
- Compute the z-score: \(z = \dfrac{13.97 - 13.12}{1.66} = \dfrac{0.85}{1.66} \approx 0.512\).
- Look up the normal CDF: \(\Phi(0.512) \approx 0.6957\).
- Percentile \(= 100 \times 0.6957 \approx\) 69.6, so about the 70th percentile.
About 30.4% of men would be larger (100 − 69.6).
Example 2: A below-average flaccid length
Suppose flaccid length is 7.5 cm. The reference values are mean 9.16 cm and SD 1.57 cm. The value is already in cm, so no conversion is needed.
- Compute the z-score: \(z = \dfrac{7.5 - 9.16}{1.57} = \dfrac{-1.66}{1.57} \approx -1.057\).
- Look up the normal CDF: \(\Phi(-1.057) = 1 - \Phi(1.057) \approx 1 - 0.8548 = 0.1452\).
- Percentile \(= 100 \times 0.1452 \approx\) 14.5, about the 14.5th percentile.
- Share of men who are larger: \(100 - 14.5 = 85.5\%\).
A negative z-score means the value is below the mean, so the percentile is under 50. A z-score of −1.057 means about one standard deviation below average, which is well within the normal range. Flaccid size varies with temperature, arousal and time of measurement, so it is a weak guide to erect size.
FAQ
What is a normal size?
Values within one standard deviation of the mean, about the 16th to 84th percentile, include roughly two thirds of men.
Does percentile say anything about sexual satisfaction?
No. Size is only one factor and satisfaction depends far more on communication, technique and intimacy.
Is this a medical tool?
No. It is for general information only. If you have concerns about your health or anatomy, speak with a doctor.