What is a percentile rank?
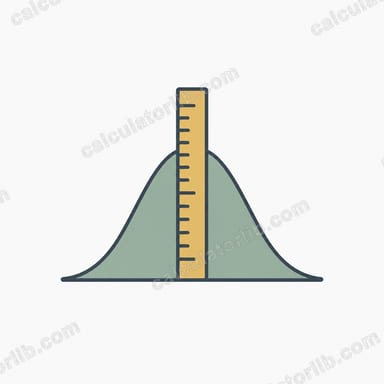
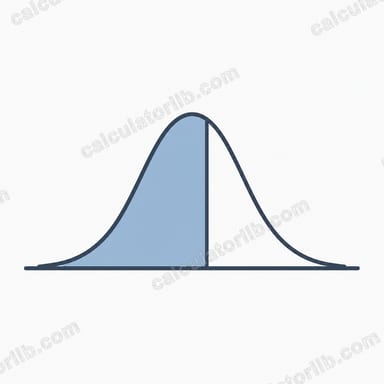
A percentile rank tells you the percentage of a population that scores at or below a given value. If your measurement sits at the 84th percentile, you outperform roughly 84 percent of the group. This calculator assumes the population follows a normal (bell-curve) distribution, which is a good model for many test scores, heights, and biometric measurements.

How to use the calculator
Enter your value, the population mean, and the population standard deviation. The tool returns the z-score, the percentile rank, and the percentage of the population above your value. The standard deviation must be greater than zero.
The formula explained
First convert the value into a z-score:
$$z = \frac{x - \mu}{\sigma}$$Here \(x\) = your value, \(\mu\) = population mean, and \(\sigma\) = population standard deviation. Then evaluate the standard normal cumulative distribution function:
$$P = 100 \times \Phi(z) = 100 \times \frac{1}{2}\left[1 + \operatorname{erf}\left(\frac{z}{\sqrt{2}}\right)\right]$$The error function is evaluated with a numerical approximation accurate to about seven decimal places.

Worked example
Suppose an IQ score of 115 with mean 100 and standard deviation 15.
$$z = \frac{115 - 100}{15} = 1$$$$P = 100 \times \Phi(1) \approx 84.13$$The score is at about the 84.13th percentile, so roughly 15.87 percent of people score higher.

Z-Score to Percentile Lookup Table
This table gives the standard normal cumulative distribution function, \(\Phi(z)\times 100\), for commonly used z-scores. It is the percentage of a normal distribution that lies at or below that z-score. Values are rounded to two decimals.
| z-score | Percentile (\(\Phi(z)\times 100\)) |
|---|---|
| -3 | 0.13 |
| -2.5 | 0.62 |
| -2 | 2.28 |
| -1.645 | 5.00 |
| -1.5 | 6.68 |
| -1 | 15.87 |
| -0.5 | 30.85 |
| 0 | 50.00 |
| 0.5 | 69.15 |
| 1 | 84.13 |
| 1.282 | 90.00 |
| 1.5 | 93.32 |
| 1.645 | 95.00 |
| 1.96 | 97.50 |
| 2 | 97.72 |
| 2.326 | 99.00 |
| 2.576 | 99.50 |
| 3 | 99.87 |
For negative z-scores, use symmetry: \(\Phi(-z)=1-\Phi(z)\). For example, z = -1.96 gives 100 - 97.50 = 2.50. The z-score itself is \(z=\frac{x-\mu}{\sigma}\). These percentiles assume the data follow a normal distribution.
Interpreting Your Percentile Result
A percentile rank tells you the share of a normal distribution that falls at or below your value. A percentile of 84 means about 84% of the distribution lies at or below that value. The calculation assumes the distribution is approximately normal with the mean and standard deviation you entered.
The 68-95-99.7 rule
- About 68.27% of values lie within ±1 standard deviation of the mean (z between -1 and 1, percentiles roughly 15.87 to 84.13).
- About 95.45% lie within ±2 standard deviations (percentiles roughly 2.28 to 97.72).
- About 99.73% lie within ±3 standard deviations (percentiles roughly 0.13 to 99.87).
What counts as typical or unusual
Percentiles near 50 are typical, since z is close to 0. By convention, values below the 2.5th percentile or above the 97.5th percentile (|z| > 1.96) are considered unusual. Some fields use |z| > 2 or |z| > 3 instead, so the threshold depends on context.
Percentiles compress near the extremes
Equal steps in z do not give equal steps in percentile. Moving from z = 0 to z = 1 raises the percentile by about 34 points (50.00 to 84.13). Moving from z = 2 to z = 3 raises it by only about 2 points (97.72 to 99.87). A raw difference in the tails can therefore look small in percentile terms even when it is large in standard deviations.
Note: a percentile describes position within a distribution only. It is not a health, medical or diagnostic judgement. Any such interpretation depends on the specific test, population and the guidance of a qualified professional.
Percentile Comparison Across Example Scenarios
The scenarios below use illustrative parameters and assume normal distributions.
| Scenario | Value | Mean | SD | z-score | Percentile |
|---|---|---|---|---|---|
| IQ-style score | 130 | 100 | 15 | 2.00 | 97.72 |
| SAT-style score | 600 | 500 | 100 | 1.00 | 84.13 |
| Same score, narrower spread | 600 | 500 | 50 | 2.00 | 97.72 |
| Adult height (cm, illustrative) | 160 | 165 | 7 | -0.71 | ≈23.8 |
| Value equal to the mean | 70 | 70 | 10 | 0.00 | 50.00 |
Worked checks
IQ-style: \(z=\frac{130-100}{15}=2.00\), so the percentile is \(100\times\Phi(2)\approx 97.72\).
Height: \(z=\frac{160-165}{7}=\frac{-5}{7}\approx -0.714\), so the percentile is \(100\times\Phi(-0.714)\approx 23.8\).
Effect of spread
The same raw score of 600 against the same mean of 500 gives z = 1.00 (84.13th percentile) when SD = 100. It gives z = 2.00 (97.72nd percentile) when SD = 50. A smaller standard deviation makes the same distance from the mean more extreme, so always check which SD applies.
FAQ
Is percentile the same as percentage?
No. A percentage is a share of a total, such as 80 out of 100 correct. A percentile describes your position relative to others.
What if my data is not normally distributed?
Then the result is only an approximation. For skewed data, rank your value against the actual dataset instead.
Does a z-score of 0 mean the 50th percentile?
Yes. A value equal to the mean sits exactly at the median of a normal distribution, so the percentile is 50.