What This Calculator Does
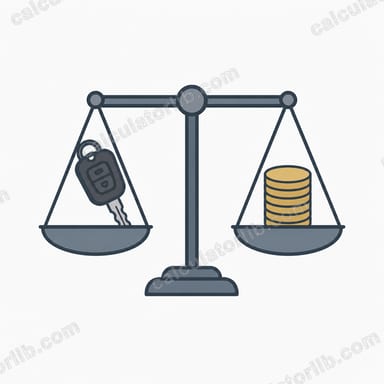
The VinFast Lease vs Buy Calculator helps you decide whether leasing or financing a VinFast electric vehicle (such as the VF 8 or VF 9) is the smarter financial move over a fixed term. It compares the total out-of-pocket lease cost against the net cost of buying, which accounts for the resale (residual) value you recover when you eventually sell the car. Figures are entered in your local currency (shown here as $).

How to Use It
Enter your quoted monthly lease payment and the lease down payment (or drive-off amount). Set the term in months — leases are commonly 24, 36, or 48 months. Then enter the monthly loan payment and down payment for buying the same vehicle, and an estimate of the car's resale value at the end of that same period. The calculator instantly tells you which option costs less and by how much.
The Formula Explained
Leasing cost is simply every monthly payment added up plus the upfront money: monthly lease \(\times\) term + lease down. Buying is treated as the total of all loan payments plus the down payment, minus the money you get back when you sell: monthly loan \(\times\) term + buy down \(-\) resale value. Subtracting resale value is what makes buying competitive, because at lease end you own nothing.
$$\Delta = \left| \text{Lease}_{\text{total}} - \text{Buy}_{\text{net}} \right|$$
$$\text{where}\quad \left\{ \begin{aligned} \text{Lease}_{\text{total}} &= \text{Monthly Lease} \times \text{Term} + \text{Lease Down} \\ \text{Buy}_{\text{net}} &= \text{Monthly Loan} \times \text{Term} + \text{Buy Down} - \text{Resale Value} \end{aligned} \right.$$

Worked Example
Suppose a VF 8 leases for $399/month with $3,000 down over 36 months. Lease total = $$399 \times 36 + 3{,}000 = \$17{,}364.$$ Buying costs $650/month with $5,000 down, and the car is worth $18,000 after 36 months. Net buy = $$650 \times 36 + 5{,}000 - 18{,}000 = \$10{,}400.$$ Buying is cheaper by $6,964 — because you keep the equity.
Central bank policy rates today
The latest official policy rates of major central banks, updated automatically — the benchmark that bank deposit and loan rates follow.
- Federal Reserve · United States
- 3.75–4.00%
- As of
- 2026-11-13
- Change in 1 year
- 0 pp
Latest change Up +25 bp Federal Reserve changed its rate on 2026-09-17: from 3.50–3.75% to 3.75–4.00%.
| Central bank | Policy rate | As of | Change in 1 year |
|---|---|---|---|
| Banco Central do Brasil (Selic) · Brazil | 13.75% | 2026-11-16 | −1.25 pp |
| Banco de México · Mexico | 6.25% | 2026-11-10 | −1.00 pp |
| Federal Reserve · United States | 3.75–4.00% | 2026-11-13 | 0 pp |
| ECB | 2.50% | 2026-11-17 | +0.50 pp |
| Sveriges Riksbank · Sweden | 2.00% | 2026-11-17 | +0.25 pp |
| Saudi Central Bank (SAMA) · Saudi Arabia | 4.50% | 2026-10-29 | 0 pp |
| Reserve Bank of Australia · Australia | 4.60% | 2026-10-31 | +1.00 pp |
| Central Bank of the Republic of Türkiye · Türkiye | 36.00% | 2026-11-06 | −3.50 pp |
| Bank of Russia · Russia | 14.00% | 2026-11-10 | −2.50 pp |
| People’s Bank of China · China | 3.00% | 2026-11-10 | 0 pp |
| Bank of Canada · Canada | 2.50% | 2026-11-13 | +0.25 pp |
| Reserve Bank of India · India | 5.50% | 2026-10-19 | 0 pp |
| Bank of England · United Kingdom | 4.00% | 2026-11-17 | 0 pp |
| Bank of Japan · Japan | 1.25% | 2026-11-10 | +0.75 pp |
| Bank of Korea · South Korea | 3.00% | 2026-11-02 | +0.50 pp |
Federal Reserve: key rates and overnight market rates
The rates that frame monetary policy and the overnight market rate they steer, each with the date of its latest published value.
| Rate | Level | As of | Change in 1 year |
|---|---|---|---|
| Federal funds target range | 3.75–4.00% | 2026-11-13 | 0 pp |
| Effective federal funds rate (EFFR) | 3.88% | 2026-11-13 | 0 pp |
| Secured Overnight Financing Rate (SOFR) | 3.90% | 2026-11-13 | −0.10 pp |
Each rate keeps the date of its own latest published value; overnight market rates are published on the next business day.
Bank interest rates in Vietnam
What commercial banks in Vietnam charge borrowers and pay savers on average, as reported by the central bank to the World Bank (annual figures).
- Lending rate 2023
- 9.32%
- Deposit rate 2023
- 4.78%
- Real interest rate 2023
- 7.01%
- Lending minus deposit 2023
- 4.54 pp
| Year | Lending rate | Deposit rate |
|---|---|---|
| 2023 | 9.32% | 4.78% |
| 2022 | 8.01% | 3.82% |
| 2021 | 7.81% | 3.38% |
| 2020 | 7.65% | 4.12% |
| 2019 | 7.71% | 4.98% |
| 2018 | 7.37% | 4.74% |
The real interest rate is the lending rate adjusted for inflation (GDP deflator). The rate a particular bank offers you can differ.
Latest figure: 2026-11-13 Data last updated 2026-11-17 · current
Source: Banco Central do Brasil ODbL; Bank for International Settlements (BIS) Terms of permitted use of BIS statistics; Federal Reserve Bank of New York New York Fed Terms of Use; Board of Governors of the Federal Reserve System Public domain (U.S. government work); European Central Bank ECB reuse policy; The World Bank Group CC BY 4.0; Sveriges Riksbank Riksbank open data terms; Reserve Bank of Australia 2026 RBA copyright terms (Cash Rate); Bank of Canada Bank of Canada terms of use; Bank of England Open Government Licence v3.0
The one-year change is computed by CalculatorLib from these data. The EFFR and SOFR are subject to the Terms of Use posted at newyorkfed.org. The New York Fed is not responsible for publication of the EFFR and SOFR by CalculatorLib, does not sanction or endorse any particular republication, and has no liability for your use.
Source details and methodology
- Banco Central do Brasil
- Bank for International Settlements (BIS) — Central bank policy rates
- Federal Reserve Bank of New York — Reference rates (EFFR, SOFR)
- Board of Governors of the Federal Reserve System
- European Central Bank
- The World Bank Group — World Development Indicators (FR.INR.DPST, FR.INR.LEND, FR.INR.RINR, FR.INR.LNDP)
- Sveriges Riksbank
- Reserve Bank of Australia 2026
- Bank of Canada
- Bank of England
FAQ
Does this include interest? Yes — interest is already baked into the monthly loan payment you enter, so the comparison reflects real cash flow.
What resale value should I use? EV resale values vary; check recent listings for the same model and mileage. A lower estimate makes buying look more expensive.
Why might leasing still win? If resale value is low or you always want the latest model, leasing's lower commitment can come out ahead despite owning nothing at the end.