
What this calculator does
Buying a home is rarely cheaper or pricier than renting on its own — it depends on your time horizon, the mortgage, taxes, upkeep and how the market moves. This Rent or Buy Calculator estimates the net cost of each path over the number of years you plan to stay, so you can compare apples to apples.
How to use it
Enter the home price, down payment, mortgage rate and term, and how many years you expect to live there. Add property tax and maintenance as a percentage of the home price per year, plus your monthly rent and how fast rent rises. The tool returns the net cost of buying, the total cost of renting, your monthly payment, the equity you build, and the gain from appreciation.
The formula explained
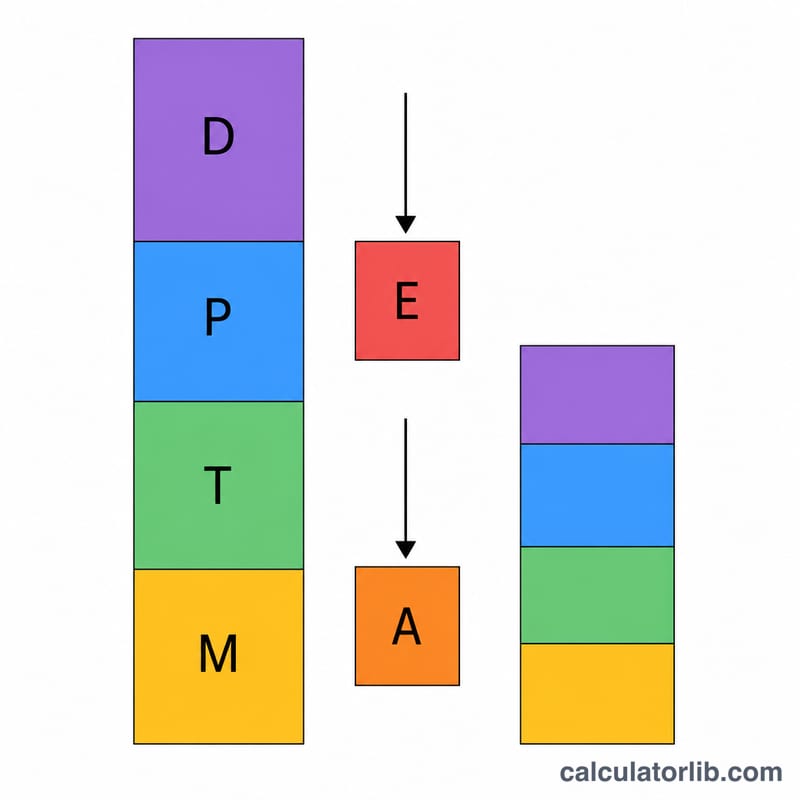
The net cost of buying adds the down payment, the mortgage payments you make while you live there, property taxes and maintenance, then subtracts the equity you accumulate (down payment plus principal paid down) and the home's appreciation gain. Rent cost simply totals twelve months of rent each year, growing rent annually. Appreciation gain here uses a simple linear estimate: price × appreciation rate × years.
$$\text{BuyCost} = D + P\cdot n + T + M - E - A$$
$$\text{Buy} = D + (\text{pmt}\cdot n) + T + M - E - A$$
$$\text{Rent} = \sum_{y=0}^{Y-1} 12\,r\,(1+g)^y$$
Worked example
A $400,000 home with 20% down ($80,000), a 6.5% 30-year mortgage, held 7 years, 3% appreciation, 1.1% tax and 1% maintenance, versus $2,000/mo rent growing 3%. Appreciation gain = $$400{,}000 \times 0.03 \times 7 = 84{,}000$$ $84,000. The calculator nets everything to show which option costs less over those 7 years.
House prices: how fast they are rising
Official house price indexes for the United States, the United Kingdom and Europe, updated automatically. An index follows the price of comparable homes over time, so the changes compare like with like.
- United States · 1 year
- +2.1%
- United States · 5 years
- +33.4%
- As of
- 2026-Q2
Mortgage rates
What a new home loan costs on average, as banks report it to the European Central Bank. The change over 12 months is computed by CalculatorLib.
- Mortgage rate · Euro area (2026-09)
- 3.62% +0.31 pp since 2025-09
United States: states with the fastest and slowest growth (2026-Q2)
National: +2.1% over 1 year, +33.4% over 5 years.
| State | 1 year | 5 years |
|---|---|---|
| Fastest growth | ||
| Alaska | +8.3% | +37.0% |
| Vermont | +7.2% | +51.8% |
| Hawaii | +5.9% | +39.1% |
| West Virginia | +5.7% | +40.5% |
| Illinois | +5.5% | +43.9% |
| Slowest growth | ||
| New Mexico | −1.2% | +34.6% |
| Washington | −1.0% | +19.6% |
| Colorado | −0.6% | +15.7% |
| California | −0.3% | +17.1% |
| Oregon | +0.2% | +15.7% |
United Kingdom: average price by nation (2026-08)
| Area | Average price | 1 year |
|---|---|---|
| United Kingdom | £273,037 | +0.9% |
| England | £293,525 | +0.4% |
| Scotland | £198,397 | +2.9% |
| Wales | £216,363 | +3.1% |
| London | £554,430 | −2.2% |
Europe: house price change by country (2025)
EU average: +5.5% over 1 year.
| Country | 1 year | 5 years |
|---|---|---|
| Hungary | +18.3% | +105.3% |
| Portugal | +17.6% | +71.0% |
| Bulgaria | +14.6% | +81.4% |
| Croatia | +13.9% | +73.9% |
| Spain | +12.7% | +41.6% |
| Slovakia | +12.4% | +40.8% |
| Czechia | +10.4% | +59.5% |
| Lithuania | +9.8% | +82.8% |
| Netherlands | +8.5% | +49.3% |
| Latvia | +7.6% | +46.8% |
| Ireland | +7.5% | +46.3% |
| Denmark | +7.5% | +25.1% |
| Slovenia | +7.3% | +58.4% |
| Malta | +6.0% | +34.7% |
| Romania | +5.7% | +28.3% |
| Norway | +5.7% | +28.2% |
| Estonia | +5.2% | +66.2% |
| Iceland | +5.1% | +66.7% |
| Poland | +4.9% | +60.2% |
| Cyprus | +4.5% | +28.4% |
| Italy | +4.0% | +15.7% |
| Germany | +3.2% | +10.1% |
| Belgium | +3.2% | +22.7% |
| Austria | +2.5% | +23.3% |
| Luxembourg | +1.6% | +9.3% |
| Sweden | +1.0% | +9.3% |
| France | +0.7% | +9.1% |
| Finland | −2.3% | −6.2% |
Germany: house price change by type of district (2026-Q2)
Destatis publishes this index by type of district, not as one national figure; each change compares with 2025-Q2.
| Type of district | 1 year |
|---|---|
| Metropolises (the 7 largest cities) | −0.4% |
| Other large independent cities | +2.0% |
| Urban districts | +0.5% |
| Rural districts with signs of densification | −1.8% |
| Sparsely populated rural districts | −0.6% |
Latest figure: 2026-Q2 Data last updated 2026-11-02 · current
Source: Federal Housing Finance Agency (FHFA), House Price Index FHFA copyright notice; Contains HM Land Registry data © Crown copyright and database right Open Government Licence v3.0; Eurostat, House price index (prc_hpi_a) Eurostat reuse policy (CC BY 4.0); © Statistisches Bundesamt (Destatis), 2026 Datenlizenz Deutschland – Namensnennung – Version 2.0; European Central Bank, MFI interest rate statistics ECB reuse policy
Percentage changes are computed by CalculatorLib from the published indexes.
Source details and methodology
- Federal Housing Finance Agency (FHFA), House Price Index
- Contains HM Land Registry data © Crown copyright and database right
- Eurostat, House price index (prc_hpi_a)
- © Statistisches Bundesamt (Destatis), 2026 — Häuserpreisindex nach siedlungsstrukturellen Kreistypen
- European Central Bank, MFI interest rate statistics
FAQ
Does this include investment of the down payment? No — it focuses on direct housing cash flows and equity, not opportunity cost on invested savings.
Are closing or selling costs included? Not by default; add them mentally to the buy side for a stricter comparison.
Why does a longer stay favor buying? Equity and appreciation accumulate over time, lowering the net cost of owning the longer you stay.
See also: Rent vs. Buy Break-Even Calculator — finds the year buying overtakes renting, using 2026 US tax rules and a 30-year schedule.