What Is Customer Retention Rate?
Customer Retention Rate (CRR) measures the percentage of existing customers a business keeps over a given period, excluding any new customers gained. It is one of the most important metrics for subscription businesses, SaaS companies, and any organization that depends on recurring revenue. A high retention rate signals satisfied, loyal customers and is far cheaper than constantly acquiring new ones.
How to Use This Calculator
Enter three numbers for the same time period (a month, quarter, or year): the number of customers you had at the start, the number you had at the end, and the number of new customers acquired during that period. The calculator instantly returns your retention rate, the count of retained customers, and your churn rate.
The Formula Explained
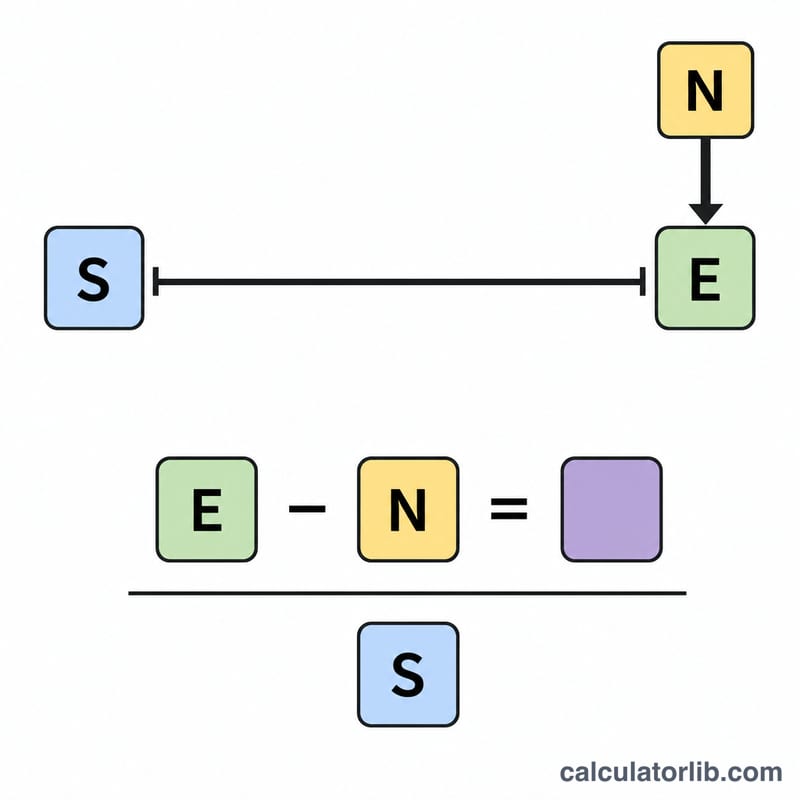
The standard CRR formula is:
$$\text{Retention Rate} = \frac{\text{Customers at End} - \text{New Customers Acquired}}{\text{Customers at Start}} \times 100$$
Subtracting new customers from the ending total isolates how many of your original customers stayed. Dividing by the starting count and multiplying by 100 turns that into a percentage. Churn rate is simply 100 minus the retention rate.
Worked Example
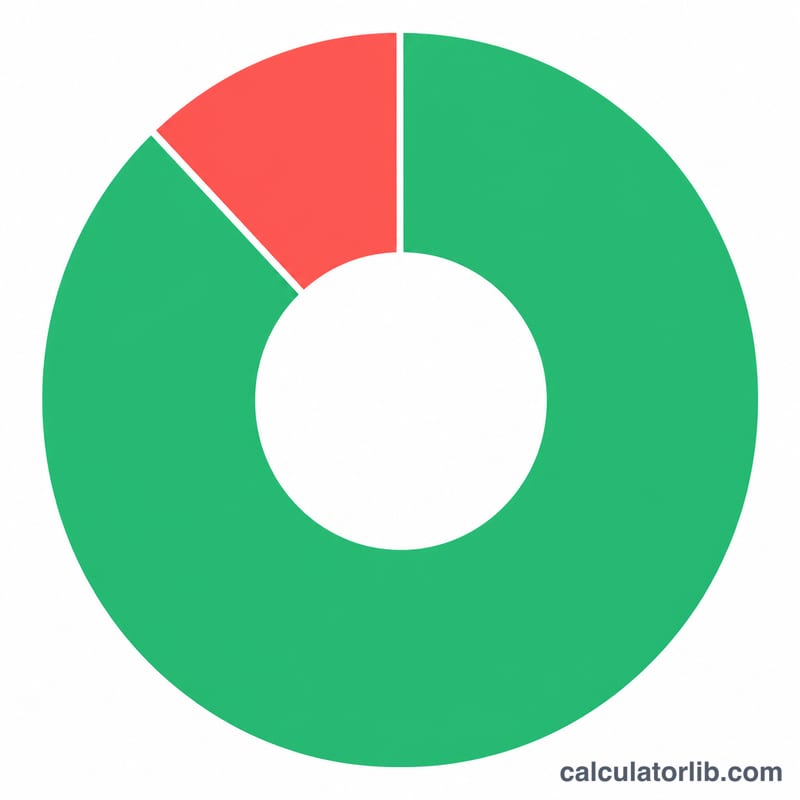
Suppose you began the quarter with 200 customers (\(S = 200\)), ended with 220 customers (\(E = 220\)), and acquired 40 new customers (\(N = 40\)). Retained = \(220 - 40 = 180\). $$\text{CRR} = \frac{180}{200} \times 100 = 90\%$$ Your churn rate is \(100 - 90 = 10\%\).
Typical Customer Retention Rates by Industry
Published industry benchmark studies (from consultancies, subscription-analytics firms and sector surveys) report widely different retention figures. The table gives only broad, approximate annual ranges to help you place your result. Treat them as rough orientation, not targets.
| Sector | Approximate annual retention (broad range) | Notes |
|---|---|---|
| SaaS / B2B subscription | ~80% to 95% | Enterprise contracts usually retain better than small-business or self-serve plans, which can fall well below this range. |
| B2C subscription (apps, boxes, memberships) | ~50% to 80% | Low switching costs and promotional sign-ups tend to raise churn. |
| E-commerce / retail | ~20% to 45% | Often measured as repeat-purchase rate, because there is no contract to cancel. |
| Telecom | ~75% to 90% | Contract terms, bundling and handset plans influence the result. |
| Media / streaming | ~40% to 75% | Usually reported as monthly churn of a few percent, which compounds to a much lower annual figure. |
| Financial services (banking, insurance) | ~80% to 95% | High switching friction supports retention; products and segments differ. |
Read these figures carefully:
- Values differ by source, definition, company size, region and time period.
- Annual and monthly rates are not directly comparable. A 95% monthly rate is only about 54% over a year (see below).
- Check that a benchmark measures the same thing you do, such as customers versus revenue, and calendar year versus rolling 12 months.
Interpreting Your Retention and Churn Results
The calculator computes \(\text{CRR} = \frac{E - N}{S} \times 100\), where \(S\) is customers at the start, \(E\) is customers at the end and \(N\) is new customers acquired in the period. Churn rate is \(100\% - \text{CRR}\).
Example: start with 1,000 customers, end with 1,100 and acquire 200 new ones. Then \(\text{CRR} = \frac{1100 - 200}{1000} \times 100 = \)90%, so churn is 10%.
What high, moderate and low generally indicate
- High CRR (near or above your sector's typical range) usually points to satisfied customers, strong product fit or high switching costs.
- Moderate CRR (around the middle of the range) suggests a mixed picture, such as strong retention in some segments and weak retention in others.
- Low CRR (clearly below your sector's range) often signals problems with onboarding, product value, pricing or service, or a customer base acquired through heavy discounting. It means each new customer must replace many departing ones.
Why the period length matters
Retention compounds over time, so a monthly rate and an annual rate describe very different outcomes. To convert a steady monthly retention rate \(r\) to an annual figure, raise it to the 12th power:
$$\text{Annual retention} = r^{12}$$
For \(r = 0.95\): \(0.95^{12} \approx 0.540\), or about 54% annual retention. A 99% monthly rate gives \(0.99^{12} \approx 0.886\), about 89%. This assumes the rate is constant, which real businesses rarely achieve. Always compare like with like: monthly with monthly, annual with annual.
Limits of the metric
- Counts customers, not revenue. Losing small customers and keeping large ones looks different in revenue retention.
- Reactivated customers. Returning former customers can be counted as new and distort the result, depending on how you record them.
- Segment differences. A blended rate can hide very different behaviour by plan, region, acquisition channel or cohort.
- Accurate inputs needed. The formula assumes the new-customer count excludes anyone who joined and left within the same period.
This is general information to help you read the metric, not business advice.
FAQ
Can retention rate exceed 100%? No. Because new customers are removed before dividing, the rate caps at 100% (when you lose zero original customers).
What is a good retention rate? It varies by industry, but SaaS companies often target 90%+ annually. Higher is almost always better.
How is retention different from churn? They are complements: retention measures who stayed, churn measures who left. They add up to 100%.