What Is a Dividend Calculator?
A dividend calculator estimates how much income you'll earn from a stock that pays dividends. By entering the number of shares you own, the dividend paid per share, and the current share price, you instantly see your total annual dividend income, the dividend yield, and the cost of your investment. It's a quick way to evaluate income-generating stocks before or after you buy.
How to Use It
Enter three values: the number of shares you hold, the dividend per share (the cash amount each share pays over a year), and the current share price. The calculator multiplies shares by dividend per share to get your income, and divides the dividend per share by the price to get the yield percentage.
The Formula Explained
Two simple equations power the tool. Dividend income is \(\text{Shares} \times \text{Dividend Per Share}\). Dividend yield is \((\text{Dividend Per Share} \div \text{Price}) \times 100\), which tells you the annual return as a percentage of what you paid. A higher yield means more income per dollar invested, though very high yields can signal risk.
$$\begin{gathered} \text{Income} = \text{Shares} \times \text{Dividend Per Share} \\[1em] \text{Yield} = \frac{\text{Dividend Per Share}}{\text{Share Price}} \times 100\% \\[1em] \text{Cost} = \text{Shares} \times \text{Share Price} \end{gathered}$$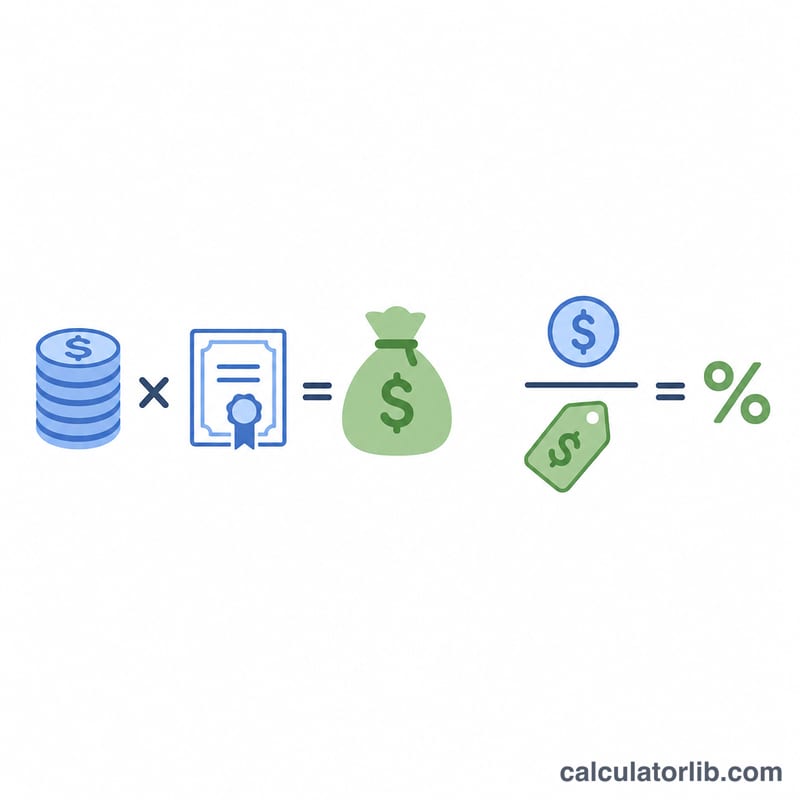
Worked Example
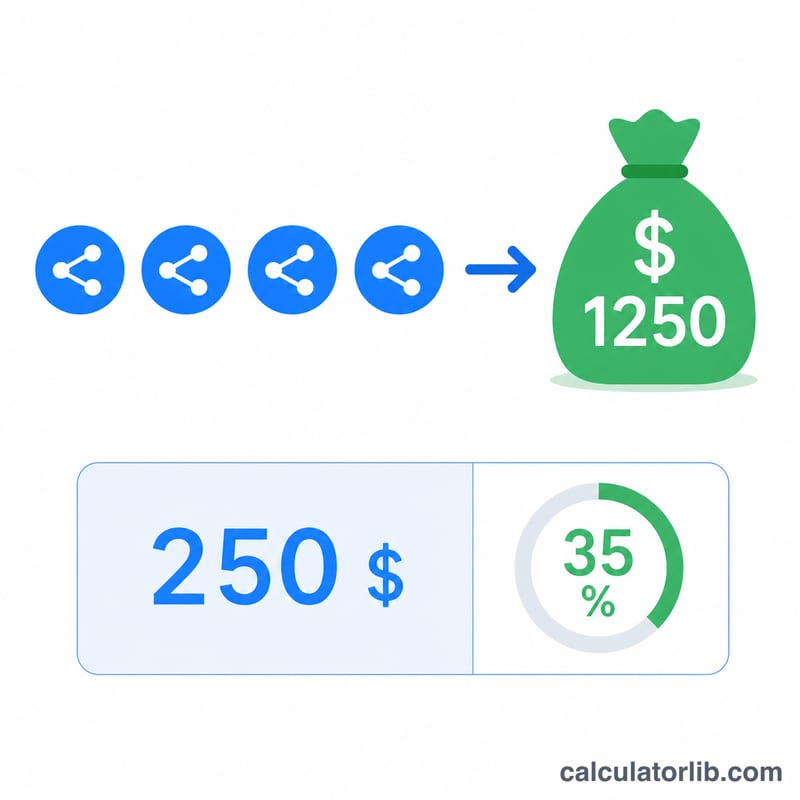
Suppose you own 100 shares of a company paying $2.50 per share annually, with shares trading at $50 each. Your annual dividend income is \(100 \times \$2.50 = \) $250. The yield is \((\$2.50 \div \$50) \times 100 = \) 5%, and your total investment cost is \(100 \times \$50 = \) $5,000.
Dividend Terms Explained
- Dividend per share (DPS)
- The cash a company pays for each share you own, usually quoted per payment or as an annual total. Annual income = shares × annual DPS.
- Dividend yield
- Annual DPS divided by the current share price, shown as a percentage: \(\text{Yield} = \frac{\text{Annual DPS}}{\text{Price}} \times 100\%\).
- Payout ratio
- The share of earnings paid out as dividends, calculated as total dividends ÷ net income, or DPS ÷ earnings per share. A high ratio leaves less room for reinvestment or for absorbing a drop in profits.
- Ex-dividend date
- The first trading day on which a new buyer is no longer entitled to the upcoming dividend. You must own the shares before this date to receive the payment. The share price often adjusts down by roughly the dividend amount on this day.
- Record date
- The date the company checks its register to see who is a shareholder entitled to the dividend. In markets with T+1 settlement (such as the US since May 2024), the ex-dividend date is generally the same as the record date, but this varies by market.
- Payment date
- The day the dividend is actually paid to eligible shareholders, typically days to weeks after the record date.
- DRIP (dividend reinvestment plan)
- A program that automatically uses your dividends to buy more shares (sometimes fractional shares) instead of paying cash, so future dividends are calculated on a larger share count.
- Yield on cost
- Current annual DPS divided by the price you originally paid per share. If you bought at $40 and the company now pays $3.00 a year, your yield on cost is 3 ÷ 40 = 7.5%, even if the current market yield is lower.
Common payment frequencies
- Quarterly: four payments a year; the usual pattern for US companies.
- Monthly: twelve payments a year; used by some REITs, funds and income-focused securities.
- Semi-annual: two payments a year; common in the UK, Australia and parts of Europe.
- Annual: one payment a year; common among many European and Asian companies.
When a calculator asks for annual dividend per share, add up all payments for the year (for example, 4 × $0.625 = $2.50).
Dividend Scenario Comparison
The calculator uses Income = Shares × DPS, Yield = DPS ÷ Price × 100%, and Cost = Shares × Price. The table shows four hypothetical scenarios (illustrative figures, not real stocks).
| Scenario | Shares | Annual DPS | Share price | Annual income | Yield | Total cost |
|---|---|---|---|---|---|---|
| A | 100 | $2.50 | $50 | $250 | 5% | $5,000 |
| B | 100 | $2.50 | $100 | $250 | 2.5% | $10,000 |
| C | 500 | $1.00 | $40 | $500 | 2.5% | $20,000 |
| D | 200 | $4.00 | $50 | $800 | 8% | $10,000 |
What the table shows
- A vs. B: Both pay $250 a year from 100 shares at $2.50 per share, but B costs twice as much, so its yield is half: \(2.50 \div 100 = 2.5\%\) versus \(2.50 \div 50 = 5\%\).
- B vs. C: Both yield 2.5%, yet C produces twice the income because it involves a larger investment ($20,000 vs. $10,000).
- D: The highest income and yield here, but a yield this high deserves a check on whether the dividend is sustainable (see the interpretation below).
Yield describes income relative to price; total income depends on how many shares you hold and the DPS. Neither number alone tells the whole story.
Interpreting Your Dividend Yield
Typical yield ranges
| Yield | General description |
|---|---|
| Below 2% | Low. Common for growth-oriented companies that reinvest most earnings or pay small dividends. |
| 2% – 4% | Moderate. Typical of many established, profitable companies. |
| 4% – 6% | Higher. Often seen in mature or income-oriented sectors such as utilities, REITs and some financials. |
| Above 6–8% | Very high. It can reflect a depressed share price, or a market expectation that the dividend may be cut. |
These ranges are rough rules of thumb, not formal standards, and what counts as normal differs by country, sector and interest-rate environment.
Yield moves inversely with price
Because price is the denominator, yield rises when price falls and falls when price rises, even if the dividend is unchanged. A $2.00 annual dividend gives \(2 \div 50 = 4\%\) at a $50 price, but \(2 \div 25 = 8\%\) if the price drops to $25. A sudden jump in yield is therefore often a sign of a falling share price rather than a generous raise.
Trailing vs. forward yield
- Trailing yield uses dividends actually paid over the past 12 months divided by the current price. It is based on facts but may be out of date if the dividend has since changed.
- Forward yield uses the expected next-12-month dividend (often the latest payment annualized, e.g. latest quarterly × 4). It is more current but depends on the company keeping or changing its payout as assumed.
Why payout ratio matters
The payout ratio shows how much of earnings goes to shareholders. For example, a company earning $4.00 per share and paying $2.00 has a payout ratio of \(2 \div 4 = 50\%\). A ratio approaching or exceeding 100% means dividends are being funded from reserves, debt or asset sales rather than profits, which may be hard to sustain. Acceptable levels vary by industry; REITs, for instance, are often structured to distribute most of their income. Earnings stability, cash flow and debt levels give further context.
This is general educational information, not investment or financial advice. Dividends are not guaranteed and can be reduced or suspended at any time.
FAQ
Is dividend per share annual or quarterly? Use the total annual dividend per share. If a company pays $0.625 quarterly, enter $2.50 for the year.
What's a good dividend yield? Many income investors look for 2–6%. Extremely high yields may not be sustainable.
Does this include taxes or reinvestment? No — it shows gross income. Dividends may be taxed depending on your jurisdiction, and reinvesting (DRIP) compounds returns over time.