
What the Dividend Discount Model Calculator Does
This calculator estimates the intrinsic value of a dividend-paying stock using the Gordon Growth version of the Dividend Discount Model (DDM). The idea is simple: a share is worth the present value of all the dividends it will ever pay, assuming those dividends grow at a steady rate forever. Instead of relying on market sentiment, it gives you a value anchored to the cash a company actually returns to shareholders. The model is used worldwide, but it works best for mature, stable companies that pay consistent and predictably growing dividends.
The Three Inputs You Enter
- Current Annual Dividend (D₀): the most recent full-year dividend per share, in your chosen currency (e.g. $2.00).
- Expected Dividend Growth Rate (g, %): the constant annual rate at which you expect dividends to grow (e.g. 5%).
- Required Rate of Return (r, %): the annual return you demand for holding the stock, given its risk (e.g. 9%).
The Formula Explained
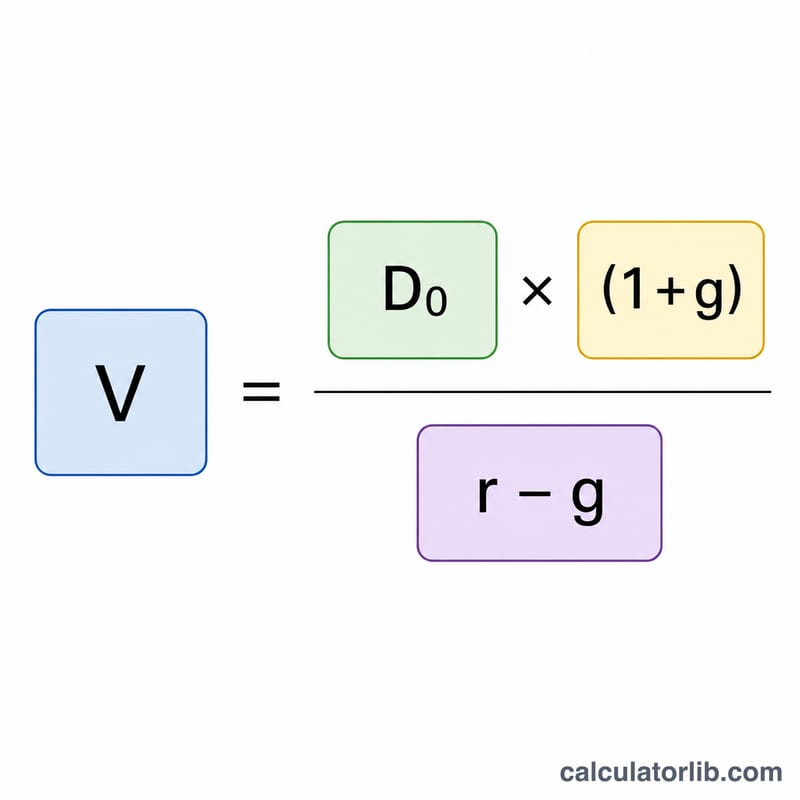
The calculator applies the Gordon Growth Model:
$$\text{Stock Value} = \frac{D_0 \times (1 + g)}{r - g}$$
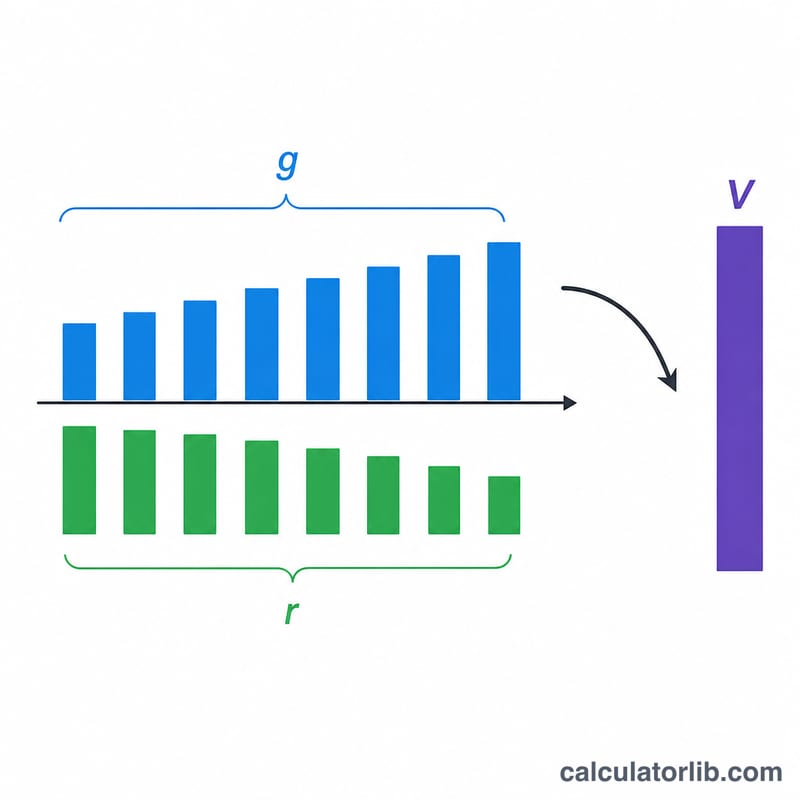
Note that the numerator uses \(D_0 \times (1 + g)\) — the next year's expected dividend (\(D_1\)). The denominator is the required return minus the growth rate. For a sensible result, \(r\) must be greater than \(g\); if growth equals or exceeds the required return, the formula breaks down and produces a negative or infinite value.
Worked Example
Suppose a stock pays a current annual dividend of $2.00, you expect dividends to grow at 5% per year, and your required return is 9%.
- Next year's dividend: \(2.00 \times (1 + 0.05) = \$2.10\)
- Denominator: \(0.09 - 0.05 = 0.04\)
- Stock Value: \(2.10 \div 0.04 = \$52.50\)
If the market price is below $52.50, the model suggests the stock may be undervalued; above it, potentially overvalued.
Frequently Asked Questions
What if r is less than or equal to g? The model requires \(r > g\). If growth matches or exceeds the required return, the result becomes meaningless (negative or undefined), because no finite value can support perpetual growth above your discount rate.
What growth rate should I use? Use a conservative, sustainable long-run figure — often based on historical dividend growth, payout ratio, or long-term GDP growth. A rate above 5–6% is rarely sustainable forever.
Does this work for non-dividend stocks? No. The model only values companies that pay dividends. For growth stocks that reinvest earnings instead of paying out, use a discounted cash flow model instead.