
What This Depreciation Calculator Does
This calculator works out how much value an asset loses each year and what it is worth at the end of its useful life. It supports two of the most widely used accounting methods — straight-line and double-declining-balance — and is suitable for businesses and individuals in most countries that follow standard accounting practice. You enter four details and it returns the annual depreciation, the total depreciation, and the final book value.
The Inputs You Enter
- Asset Cost – the original purchase price of the asset.
- Salvage Value – the estimated resale or scrap value at the end of its life.
- Useful Life (years) – how many years you expect to use the asset.
- Depreciation Method – choose Straight Line for equal annual amounts, or Declining Balance for larger write-offs in the early years.
The Formulas Used
Straight Line: the depreciable base (Cost − Salvage) is divided equally across the years:
- Annual depreciation $$D_{\text{annual}} = \frac{\text{Asset Cost} - \text{Salvage Value}}{\text{Useful Life}}$$
- Total depreciation \(= \text{Asset Cost} - \text{Salvage Value}\)
- Final book value \(= \text{Salvage Value}\)
Declining Balance: the calculator uses the double-declining rate of \(2 \div \text{Useful Life}\), applied to the remaining book value each year. As soon as a year's depreciation would push the book value below the salvage value, it is capped so the asset never depreciates below salvage. Each year's figure is listed separately.
$$\begin{gathered} D_{t} = BV_{t-1} \times r, \qquad BV_{t} = BV_{t-1} - D_{t} \\[1.5em] \text{where}\quad \left\{ \begin{aligned} r &= \frac{2}{\text{Useful Life}} \\ BV_{0} &= \text{Asset Cost} \\ BV_{t} &\geq \text{Salvage Value} \end{aligned} \right. \end{gathered}$$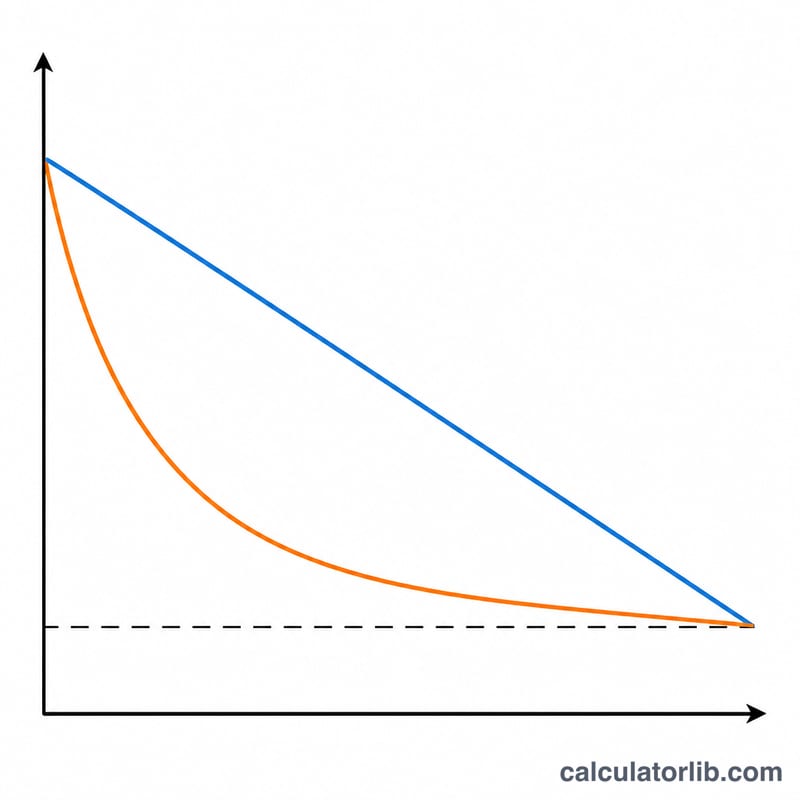
Worked Example
Suppose an asset costs $10,000, has a $1,000 salvage value and a 5-year life.
- Straight line: $$(\$10{,}000 - \$1{,}000) \div 5 = \$1{,}800 \text{ per year}$$ Total depreciation $9,000; final book value $1,000.
- Declining balance: rate \(= 2 \div 5 = 40\%\). Year 1: $4,000 (book value $6,000), Year 2: $2,400, Year 3: $1,440, Year 4: $864, and the remaining amount is capped so book value lands at the $1,000 salvage value.
FAQ
Which method should I choose? Straight line spreads cost evenly and suits assets that wear out steadily. Declining balance front-loads expense and suits assets like computers or vehicles that lose value fastest early on.
Why does declining balance stop early sometimes? The calculator halts once book value reaches the salvage value, since an asset cannot be depreciated below its salvage estimate.
Does salvage value affect declining balance? Yes — it sets the floor. The percentage rate ignores salvage during the calculation, but the final year is adjusted so book value never falls below it.