
What this Erlang C calculator answers
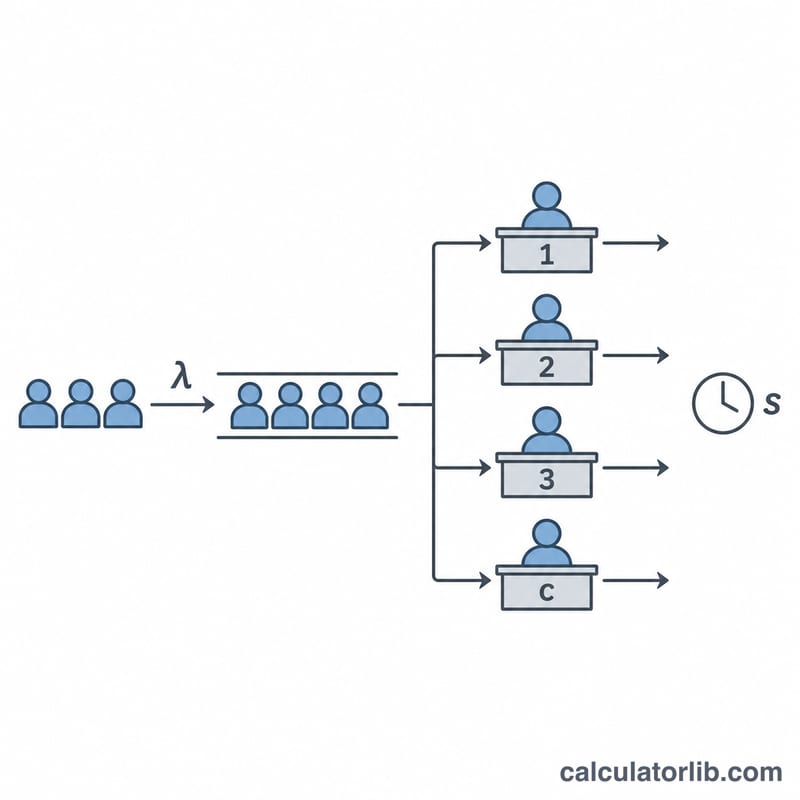
"How many agents do we need on the phones?" and "how many servers do we need at launch?" are the same question. Requests arrive at random, each one occupies a server for a while, and anyone who finds every server busy waits in line. This calculator models that as an M/M/c queue and uses Erlang's C formula, first published by the Danish engineer A. K. Erlang in 1917, to give you the probability of waiting, the average wait, the queue length and the share of arrivals answered within a target time.
It then works backwards: it finds the smallest number of servers that meets your service-level target (and, if you set one, a maximum average wait) and shows a short table around that number so you can see what one server more or less changes.
How to use it
- Arrival rate λ: calls, chats, tickets or requests per second, minute or hour. Use the rate for your busiest interval, not a daily average.
- Average service time: average handle time per arrival (talk plus after-call work in a contact centre, or request processing time for a server). You can also enter the service rate μ per server instead.
- Servers c: agents, workers, threads or machines that serve in parallel. Leave it blank to see the results at the recommended number.
- Service-level target: the share of arrivals that should wait no longer than T. The default of 80% within 20 seconds is a widely used example, not a law or a standard. Use your own target.
The same tool covers IT capacity: enter requests per second and a service time in milliseconds, and read "servers" as concurrent workers.
The formulas
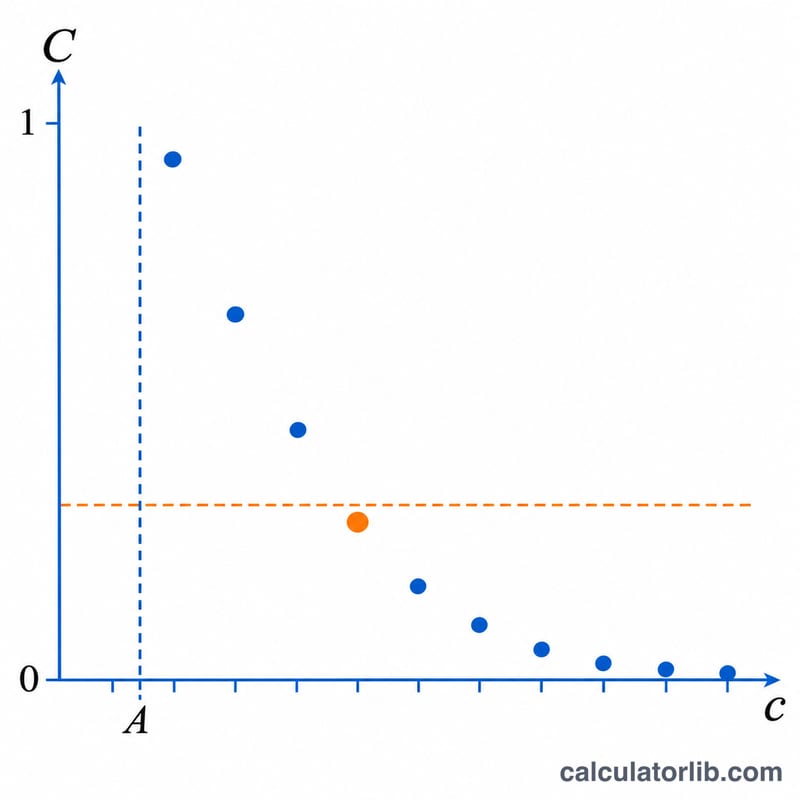
With arrival rate λ and mean service time s (service rate μ = 1/s), the offered traffic is A = λ/μ erlangs and the utilization is ρ = A/c. The queue is only stable when A < c. If it is not, the queue grows without limit and the calculator tells you so instead of printing a number.
The probability that an arrival has to wait is Erlang C, C(c, A). The calculator gets it from the Erlang B recursion Bk = A·Bk−1 / (k + A·Bk−1) and C = c·B / (c − A(1 − B)). That route uses no factorials, so it stays accurate for thousands of servers. From C:
- average wait in queue Wq = C / (cμ − λ), and average time in system W = Wq + 1/μ;
- average queue length Lq = λWq, and average number in system L = Lq + A;
- service level P(Wq ≤ T) = 1 − C·e−(cμ−λ)T (first come, first served).
The numbers obey Little's law, L = λW, which the result shows as a check. You can cross-check it with the throughput calculator (Little's law).
Worked example
A support desk receives 120 calls per hour (2 per minute) and the average handle time is 4 minutes, so A = 2 × 4 = 8 erlangs. With 10 agents the utilization is 80%, 40.9% of callers wait, the average wait is about 49 seconds and only 65.4% are answered within 20 seconds. With 11 agents the probability of waiting falls to 24.5%, the average wait to 19.6 seconds and the service level rises to 80.9%. So 11 agents meet an 80%-in-20-seconds target. With 12 agents it would be 90.0%.
Textbook check: in Iversen's Teletraffic Engineering and Network Planning (Example 9.3.1), a system with 20 erlangs of traffic, a 100-second mean service time and 32 channels has a mean waiting time of 0.075 s. This calculator gives 0.0747 s.
IT example: 5,000 requests per second at 120 ms each is A = 600 erlangs. For 99% of requests to start within 50 ms, you need 610 concurrent workers. That is 98.4% utilization with an average queueing delay of about 7 ms.
Assumptions and limits
- Arrivals are random and independent (a Poisson process), and service times are exponentially distributed.
- Arrivals are served first come, first served by identical servers, and the waiting room is unlimited.
- Nobody gives up. Real callers do hang up, and then Erlang C overstates waiting and the staff you need. The Erlang A model (M/M/N+M, Garnett, Mandelbaum & Reiman, 2002) adds abandonment.
- The result is for agents actually available to take calls. Add breaks, training and absence (shrinkage) on top.
- Bursty traffic, retries and very variable service times usually make queues worse than the model predicts. Treat the answer as a lower bound, then test with real load.
For parallel speed-up limits on a single job, see the Amdahl's law calculator.