
What Is a Fibonacci Retracement?
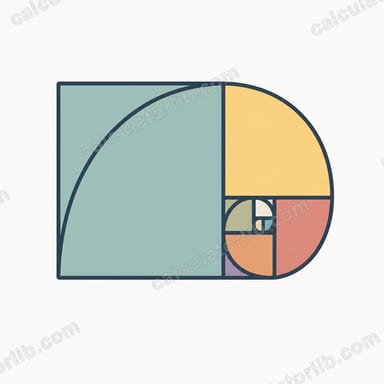
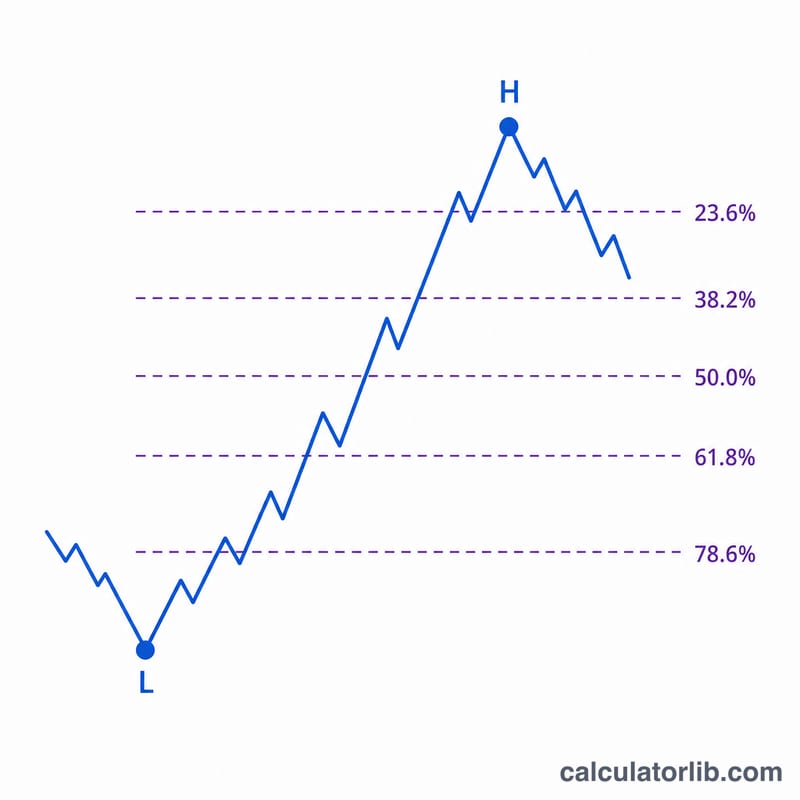
Fibonacci retracement is a popular technical-analysis tool that traders use to identify potential support and resistance levels. After a strong price move, markets often pull back ("retrace") a portion of that move before continuing in the original direction. The key retracement ratios — 23.6%, 38.2%, 50%, 61.8% and 78.6% — are derived from the Fibonacci number sequence and tend to act as zones where price may pause or reverse.
How to Use the Calculator
Pick the trend direction, then enter the swing high (the peak of the move) and the swing low (the trough). For an uptrend, levels are projected downward from the high; for a downtrend, they are projected upward from the low. The calculator instantly returns each retracement price so you can plot support and resistance on your chart.
The Formula Explained
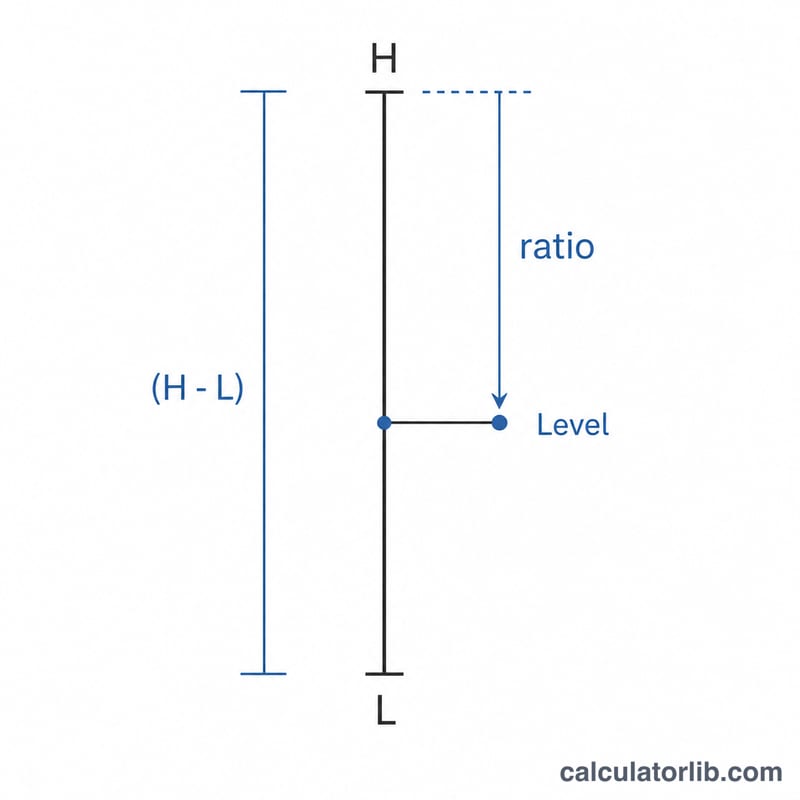
The full range of the move is High − Low. Each level is found by subtracting a fraction of that range from the high:
$$\text{Level} = \text{High} - (\text{High} - \text{Low}) \times \text{ratio}$$
For example, the 61.8% level subtracts 61.8% of the range from the high. The 0% level is the high itself and the 100% level is the low.
Worked Example
Suppose a stock rallied from a swing low of 100 to a swing high of 150, giving a range of 50. The 38.2% retracement is $$150 - (50 \times 0.382) = 150 - 19.1 = \mathbf{130.9}.$$ The 61.8% "golden" level is $$150 - (50 \times 0.618) = 150 - 30.9 = \mathbf{119.1}.$$ The 50% midpoint is $$150 - 25 = \mathbf{125}.$$
FAQ
Is 50% a real Fibonacci ratio? Technically no — it is not derived from the sequence — but traders include it because price often reverses at the midpoint of a move.
Which level is most important? The 61.8% level (the golden ratio) is the most closely watched, followed by 38.2% and 50%.
Does this work for any market? Yes. Fibonacci retracement is applied to stocks, forex, crypto, commodities and indices — any market with identifiable swing highs and lows.