What Is GDP per Capita?
GDP per capita measures a country's economic output per person. It is calculated by dividing the total Gross Domestic Product (GDP) by the population. Economists use it as a rough indicator of average prosperity and standard of living, making it easier to compare economies of different sizes on a like-for-like basis.
How to Use This Calculator
Enter the total GDP (in any currency unit you like — dollars, euros, etc.) and the total population. The calculator divides one by the other and returns the GDP per capita expressed in the same currency unit per person. Make sure both figures cover the same time period (usually one year) and the same region for a meaningful result.
The Formula Explained
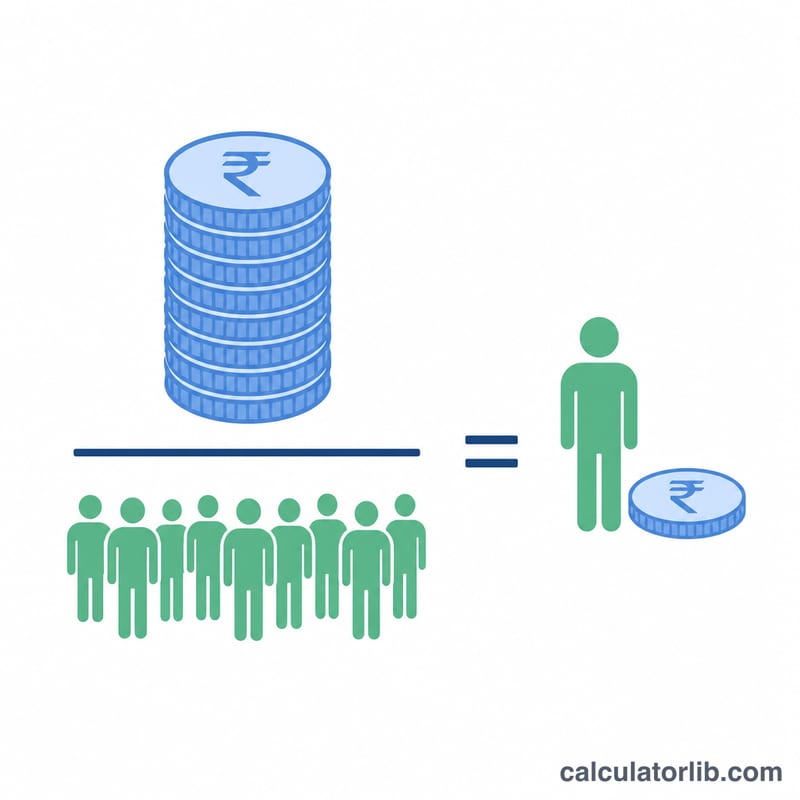
The formula is simply $$\text{GDP per Capita} = \frac{\text{GDP}}{\text{Population}}$$. If GDP is the total value of all goods and services produced in a year, dividing by the number of people spreads that output evenly across the population, giving an average per-person figure. It does not reflect how income is actually distributed.
Worked Example
Suppose a country has a GDP of 25,000,000,000,000 (25 trillion) and a population of 335,000,000. Dividing 25 trillion by 335 million gives approximately 74,627 per person.
$$\text{GDP per Capita} = \frac{25{,}000{,}000{,}000{,}000}{335{,}000{,}000} \approx 74{,}627$$
That figure represents the average economic output attributable to each resident.
Interpreting GDP per Capita Results
GDP per capita is total gross domestic product divided by population: \(\text{GDP per capita} = \frac{\text{GDP}}{\text{Population}}\). It estimates the average value of goods and services produced per person in a year. It is a rough indicator of average economic output, not of individual income or well-being.
What high, middle and low values generally signify
- High GDP per capita: the economy produces a lot of output per resident. This is typical of economies with high productivity, large capital stocks, and substantial services or advanced industry. Some small economies with large financial sectors or resource exports can also rank high.
- Middle GDP per capita: output per person is moderate. These economies are often industrializing or shifting from agriculture toward manufacturing and services.
- Low GDP per capita: output per person is small. This usually reflects low productivity, limited capital and infrastructure, and a large share of the population in subsistence or low-productivity work.
Important caveats
- It is an average. It says nothing about how output or income is distributed, so two countries with the same figure can have very different levels of inequality.
- Informal and non-market activity is missed or underestimated. Unpaid household work, volunteering, and much informal or untaxed activity are not fully captured in GDP.
- Cost of living differs. The same dollar amount buys different amounts of goods and services in different countries.
- Output is not the same as income. Profits sent abroad or large foreign-owned production can make GDP differ markedly from what residents actually earn (see GNI in the glossary).
Nominal vs PPP comparisons
Nominal GDP per capita converts output to a common currency (usually US dollars) at market exchange rates, so it is affected by exchange-rate swings. PPP-adjusted GDP per capita uses conversion rates that equalize the price of a comparable basket of goods, which is generally better for comparing living standards across countries. Do not mix the two in one comparison.
Data consistency
For a meaningful result, use GDP and population from the same year, in the same currency and price basis (current or constant prices), and from the same source. Population is normally a mid-year estimate. Enter GDP and population in consistent units, for example both as full numbers rather than one in billions and the other in individual people. This is general information, not financial advice.
World Bank Income Group Thresholds
The World Bank classifies economies into four income groups using GNI per capita (calculated with the Atlas method, in current US$), not GDP per capita. The two measures are related but not identical, so these thresholds are only approximate benchmarks when you are comparing a GDP per capita result.
| Income group | GNI per capita (Atlas method, current US$) |
|---|---|
| Low income | $1,145 or less |
| Lower-middle income | $1,146 to $4,515 |
| Upper-middle income | $4,516 to $14,005 |
| High income | More than $14,005 |
Source: World Bank country classifications by income level, fiscal year 2025 (effective 1 July 2024, based on 2023 GNI per capita). The World Bank revises the thresholds every July, so check the World Bank website for the current edition.
Key Terms: GDP, Nominal, Real and PPP
- GDP (gross domestic product)
- The total market value of final goods and services produced within a country's borders in a given period, usually a year. It is the numerator in the calculation.
- Population (mid-year estimate)
- The estimated number of residents at the middle of the year, used as an average for the whole year. It is the denominator, and using a different date or definition changes the result.
- Nominal GDP
- GDP measured at current prices and, for international comparison, converted at market exchange rates. Inflation and exchange-rate moves affect it directly.
- Real GDP
- GDP adjusted for inflation by using constant prices from a base year. Use it to compare per-person output over time without the effect of rising prices.
- PPP (purchasing power parity)
- A conversion method that adjusts for differences in price levels between countries. PPP-adjusted GDP per capita better reflects what incomes can buy locally.
- GNI (gross national income)
- GDP plus net income received from abroad (such as wages and investment income). It measures the income of a country's residents and is the basis for World Bank income groups.
- Per capita
- Latin for "by head": a total divided by the number of people. It gives a simple average and hides differences between individuals.
GDP and GDP per capita: United States
Official GDP and population figures for United States, updated automatically. They work the formula above with real numbers.
- GDP per capita 2025
- 90,027 USD
- GDP 2025
- 30,770 billion USD
- Population 2025
- 341.78 million
Latest change Up +4.5% 2025: 90,027 USD, against 86,170 USD in 2024. CalculatorLib computes this change from the two published figures.
In 2025, the GDP of United States was 30,770 billion USD and its population 341.78 million: 30,770 billion ÷ 341.78 million = 90,027 USD per person.
GDP deflator 2025: nominal GDP 30,770 billion USD ÷ real GDP 25,147 billion USD × 100 = 122.36.
| Year | GDP (billion USD) | Population (million) | GDP per capita (USD) | GDP deflator |
|---|---|---|---|---|
| 2025 | 30,770 | 341.78 | 90,027 | 122.4 |
| 2024 | 29,298 | 340.00 | 86,170 | 119.0 |
| 2023 | 27,812 | 336.76 | 82,587 | 116.1 |
| 2022 | 26,055 | 334.00 | 78,009 | 112.0 |
| 2021 | 23,726 | 332.10 | 71,441 | 104.6 |
| 2020 | 21,375 | 331.58 | 64,465 | 100.0 |
| 2019 | 21,540 | 330.23 | 65,228 | 98.7 |
| 2018 | 20,657 | 328.53 | 62,876 | 97.1 |
| 2017 | 19,612 | 326.61 | 60,048 | 94.9 |
| 2016 | 18,805 | 324.35 | 57,977 | 93.2 |
United States and other countries
GDP per capita in current US dollars — each country’s latest published year.
- United States 90,027 USD (2025)
- France 48,986 USD (2025)
- South Korea 36,227 USD (2025)
- Japan 35,951 USD (2025)
- Saudi Arabia 34,537 USD (2025)
- Türkiye 18,599 USD (2025)
- Russia 17,547 USD (2025)
- World 14,406 USD (2025)
- Mexico 13,889 USD (2025)
- China 13,862 USD (2025)
- Vietnam 5,066 USD (2025)
- India 2,702 USD (2025)
No published figure yet for Taiwan.
Years can differ between rows: each figure is shown with its own year. The same World Bank indicator for every country.
Latest figure: 2025 Data last updated 2026-10-17 · current
Source: The World Bank Group CC BY 4.0; World Bank, World Development Indicators CC BY 4.0
The GDP ÷ population example and the GDP deflator worked from nominal and real GDP are computed by CalculatorLib from these data.
Source details and methodology
- The World Bank Group — World Development Indicators (NY.GDP.PCAP.CD, NY.GDP.MKTP.CD, NY.GDP.DEFL.ZS, NY.GDP.MKTP.CN, NY.GDP.MKTP.KN)
- World Bank, World Development Indicators — World Development Indicators (SP.POP.TOTL)
FAQ
Is GDP per capita the same as average income? Not exactly. It is total output per person, which differs from disposable income or wages, but it correlates with living standards.
Should I use nominal or real GDP? Use nominal GDP for current comparisons and real (inflation-adjusted) GDP for tracking growth over time.
Does it account for inequality? No. It is an average, so a high GDP per capita can mask large differences in how wealth is distributed.