
What this calculator does
This tool illustrates the difference between nominal value and real value using a simplified one-good economy where GDP equals quantity times price. Nominal GDP measures output at the prices actually traded in that year (current prices), while real GDP values output at a fixed base-year price so that pure price changes (inflation) are stripped out. By comparing the two for Year 2, you can see how much of the headline nominal growth was genuine output growth versus mere price inflation.
How to use it
Enter the quantity of the single good sold and its unit price for two consecutive years. Year 1 is treated as the base year. The calculator returns Year 1 GDP (where nominal and real are identical by definition), Year 2 real GDP (Year-2 quantity valued at Year-1 prices), Year 2 nominal GDP (valued at Year-2 prices), plus the GDP deflator and both growth rates. Values are shown in yen, but the logic works with any currency.
The formula explained
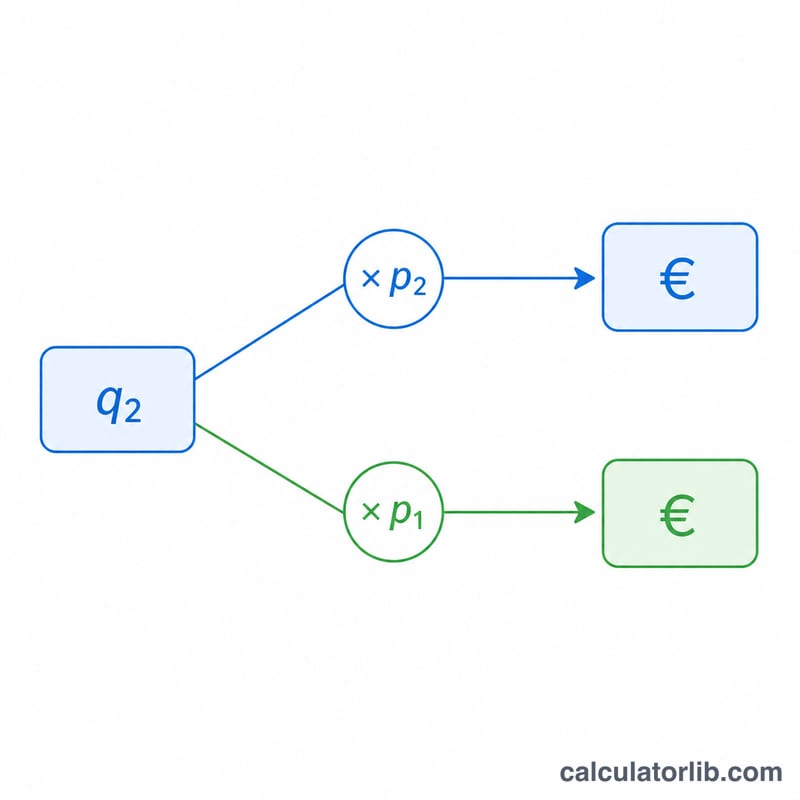
For the base year, Real GDP = \(q_1 \times p_1\). For Year 2, Real GDP = \(q_2 \times p_1\) (current quantity, base price) and Nominal GDP = \(q_2 \times p_2\) (current quantity, current price). The GDP deflator = Nominal ÷ Real × 100, and growth rates compare each Year-2 figure with Year 1.
$$\begin{gathered} \text{Year 2 Real GDP} = \text{Year 2 Quantity} \times \text{Year 1 Price} \\[1.5em] \text{Year 2 Nominal GDP} = \text{Year 2 Quantity} \times \text{Year 2 Price} \end{gathered}$$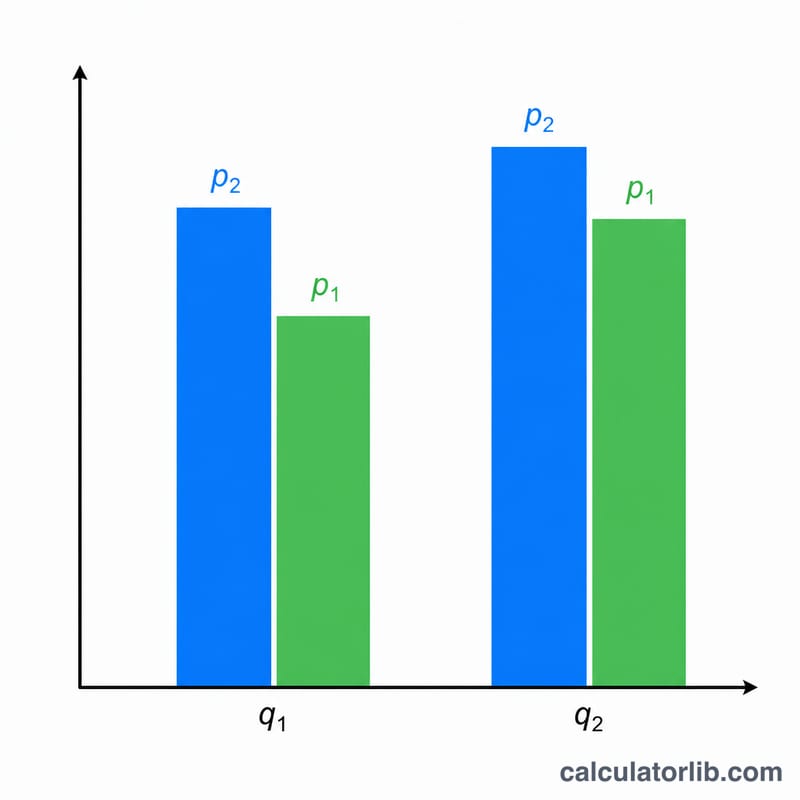
Worked example
With \(q_1=10\), \(p_1=100\), \(q_2=11\), \(p_2=120\): Year 1 GDP = \(10 \times 100 = 1{,}000\). Year 2 real GDP = \(11 \times 100 = 1{,}100\). Year 2 nominal GDP = \(11 \times 120 = 1{,}320\). The deflator = \(1{,}320 \div 1{,}100 \times 100 = 120\) (prices rose 20%). Real growth = \((1{,}100/1{,}000 - 1) \times 100 = 10\%\), matching the extra unit sold, while nominal growth = \((1{,}320/1{,}000 - 1) \times 100 = 32\%\), combining output growth and inflation.
FAQ
Why are nominal and real GDP equal in Year 1? Year 1 is the base year, so the reference price is its own price — there is no price change to remove.
What does a deflator above 100 mean? It means the overall price level rose relative to the base year; a deflator of 120 indicates 20% price inflation.
Does this apply to real economies? Real GDP aggregates many goods using a common base-year price set (\(\Sigma\, q_i \cdot p_i\)), but the nominal-versus-real principle is exactly the same as in this one-good model.