What is the National Income (NI) Calculator?
This tool computes National Income (NI) — the total income actually received by a nation's residents — from Gross Domestic Product (GDP). While GDP measures the value added produced within a country's borders (a production-side measure), National Income is an income-side measure of what the nation's people earn. The calculator follows the standard System of National Accounts arithmetic and applies universally; it is not tied to any single country.
How to use it
Enter five amounts, all expressed in the same currency and the same scale (for example all in trillion yen, or all in billion USD): GDP, net factor income from abroad, depreciation, indirect taxes, and subsidies. The calculator does not convert currencies or scales, so consistency is the only requirement. Net factor income from abroad may be negative if a country pays more factor income abroad than it receives.
The formula explained
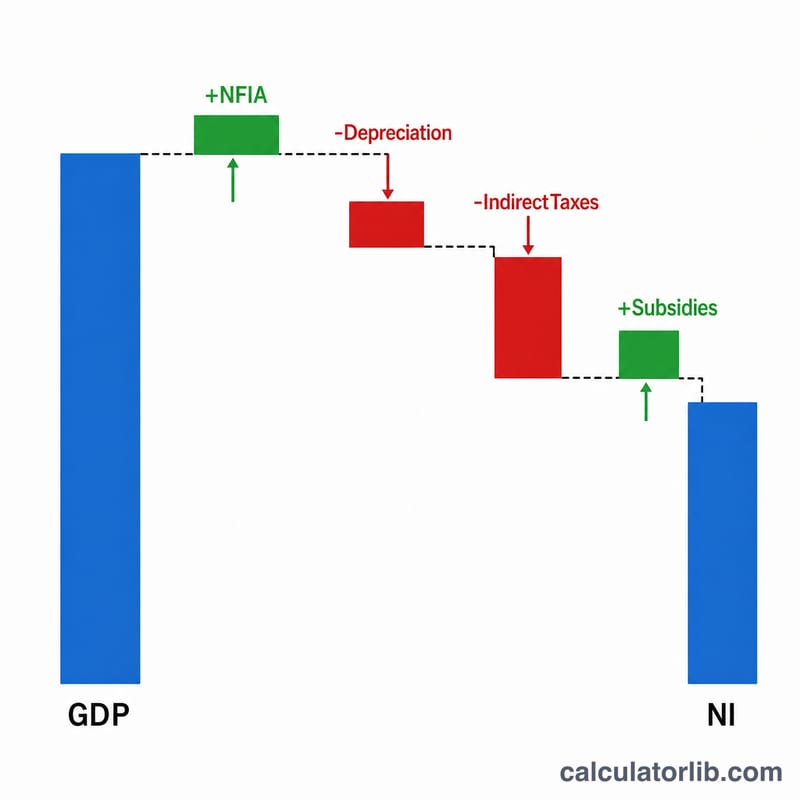
The conversion happens in three steps. First, \(\text{GNP} = \text{GDP} + \text{Net Factor Income from Abroad}\) (equivalently GNI). Second, \(\text{NNP} = \text{GNP} - \text{Depreciation}\), removing the capital consumption allowance. Third, \(\text{NI} = \text{NNP} - \text{Indirect Taxes} + \text{Subsidies}\), which restates the figure from market prices to factor cost. Combined into one identity:
$$\text{NI} = \text{GDP} + \text{NFIA} - \text{Depreciation} - \text{Indirect Taxes} + \text{Subsidies}$$No division occurs, so there is no divide-by-zero risk.
Worked example
Suppose GDP = 500, net factor income from abroad = 20, depreciation = 80, indirect taxes = 40, and subsidies = 10 (all in trillion units). Then \(\text{GNP} = 500 + 20 = 520\); \(\text{NNP} = 520 - 80 = 440\); and
$$\text{NI} = 440 - 40 + 10 = 410 \text{ trillion units}$$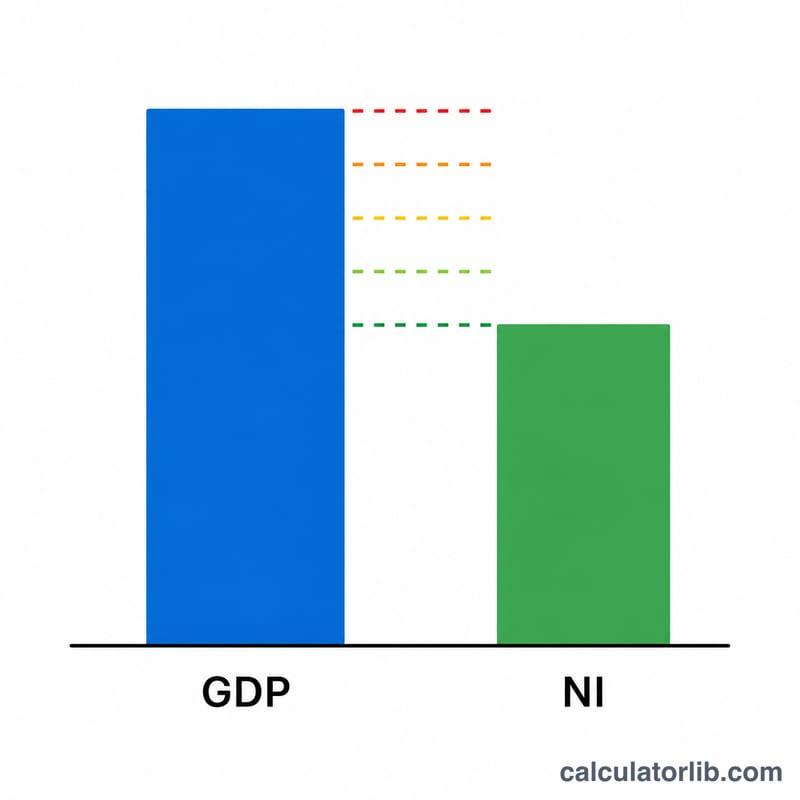
GDP and GDP per capita: United States
Official GDP and population figures for United States, updated automatically. They work the formula above with real numbers.
- GDP per capita 2025
- 90,027 USD
- GDP 2025
- 30,770 billion USD
- Population 2025
- 341.78 million
Latest change Up +4.5% 2025: 90,027 USD, against 86,170 USD in 2024. CalculatorLib computes this change from the two published figures.
In 2025, the GDP of United States was 30,770 billion USD and its population 341.78 million: 30,770 billion ÷ 341.78 million = 90,027 USD per person.
GDP deflator 2025: nominal GDP 30,770 billion USD ÷ real GDP 25,147 billion USD × 100 = 122.36.
| Year | GDP (billion USD) | Population (million) | GDP per capita (USD) | GDP deflator |
|---|---|---|---|---|
| 2025 | 30,770 | 341.78 | 90,027 | 122.4 |
| 2024 | 29,298 | 340.00 | 86,170 | 119.0 |
| 2023 | 27,812 | 336.76 | 82,587 | 116.1 |
| 2022 | 26,055 | 334.00 | 78,009 | 112.0 |
| 2021 | 23,726 | 332.10 | 71,441 | 104.6 |
| 2020 | 21,375 | 331.58 | 64,465 | 100.0 |
| 2019 | 21,540 | 330.23 | 65,228 | 98.7 |
| 2018 | 20,657 | 328.53 | 62,876 | 97.1 |
| 2017 | 19,612 | 326.61 | 60,048 | 94.9 |
| 2016 | 18,805 | 324.35 | 57,977 | 93.2 |
United States and other countries
GDP per capita in current US dollars — each country’s latest published year.
- United States 90,027 USD (2025)
- France 48,986 USD (2025)
- South Korea 36,227 USD (2025)
- Japan 35,951 USD (2025)
- Saudi Arabia 34,537 USD (2025)
- Türkiye 18,599 USD (2025)
- Russia 17,547 USD (2025)
- World 14,406 USD (2025)
- Mexico 13,889 USD (2025)
- China 13,862 USD (2025)
- Vietnam 5,066 USD (2025)
- India 2,702 USD (2025)
No published figure yet for Taiwan.
Years can differ between rows: each figure is shown with its own year. The same World Bank indicator for every country.
Latest figure: 2025 Data last updated 2026-10-17 · current
Source: The World Bank Group CC BY 4.0; World Bank, World Development Indicators CC BY 4.0
The GDP ÷ population example and the GDP deflator worked from nominal and real GDP are computed by CalculatorLib from these data.
Source details and methodology
- The World Bank Group — World Development Indicators (NY.GDP.PCAP.CD, NY.GDP.MKTP.CD, NY.GDP.DEFL.ZS, NY.GDP.MKTP.CN, NY.GDP.MKTP.KN)
- World Bank, World Development Indicators — World Development Indicators (SP.POP.TOTL)
FAQ
I only know GNP, not GDP — can I still use this? Yes. Set GDP equal to GNP and set net factor income from abroad to 0, since \(\text{GNP} = \text{GDP} + \text{net factor income from abroad}\).
What if I already have NNP at factor cost? Set indirect taxes and subsidies both to 0; the indirect-taxes-net-of-subsidies term is just the market-price-to-factor-cost wedge.
Can values be negative? Net factor income from abroad can certainly be negative, and the identity still holds. The other components are normally non-negative in practice.