What Is an Occupancy Rate?
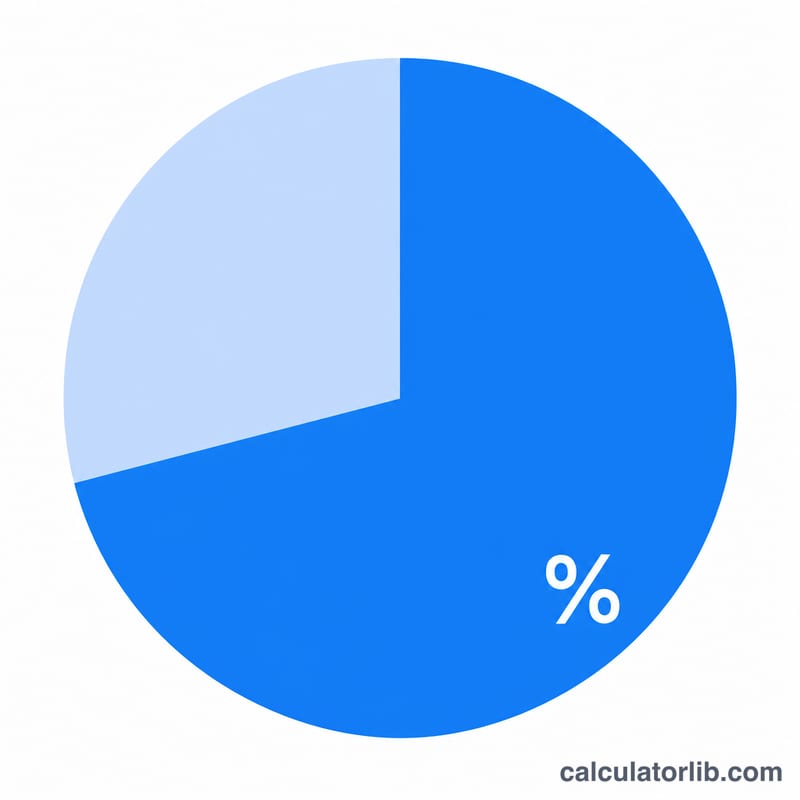
Occupancy rate is the percentage of available units that are currently in use. It is a core performance metric in hospitality, residential and commercial real estate, healthcare (hospital beds), parking, and event venues. A higher occupancy rate generally signals stronger demand and more efficient use of capacity, while a low rate points to vacancy that may need pricing, marketing, or operational attention.
How to Use This Calculator
Enter the number of occupied units and the total available units, then read your occupancy rate instantly. "Units" can be hotel rooms, apartments, beds, seats, desks, or parking spaces — just keep both numbers in the same units. The calculator also returns the number of vacant units and the corresponding vacancy rate so you see the full picture.
The Formula Explained
The calculation is simply:
$$\text{Occupancy Rate (\%)} = \frac{\text{Occupied Units}}{\text{Total Available Units}} \times 100$$
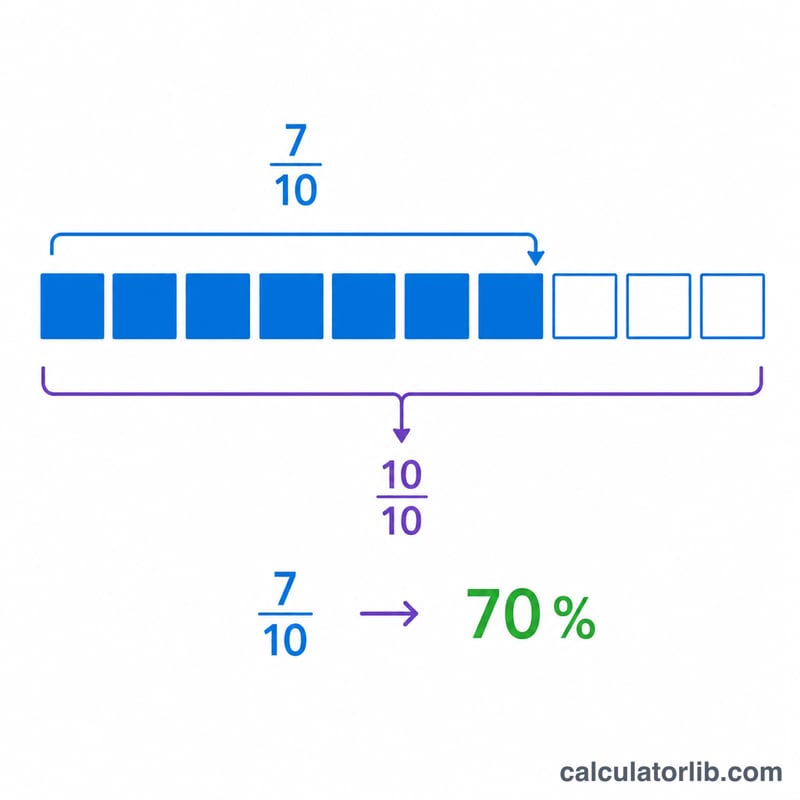
Dividing occupied by total gives the fraction in use, and multiplying by 100 converts it to a percentage. Vacancy rate is the mirror image: \((\text{Total} - \text{Occupied}) \div \text{Total} \times 100\), which always equals 100% minus the occupancy rate.
Worked Example
Suppose a hotel has 120 rooms and 96 are booked tonight. Occupancy rate = $$(96 \div 120) \times 100 = \mathbf{80\%}$$ There are 24 vacant rooms, giving a vacancy rate of \((24 \div 120) \times 100 = 20\%\). The owner can use this to benchmark against last year or against a target like 85%.
Typical Occupancy Rates by Industry
The ranges below are approximate, commonly cited figures. They vary by country, city, property class, season and data source, so treat them as indicative rather than fixed standards or targets.
| Sector | Approximate typical occupancy | Notes |
|---|---|---|
| Hotels | about 60–80% | Depends heavily on market, season and day of week; resort and city markets differ widely. |
| Long-term residential rentals / multifamily | about 90–95%+ | Typical of stabilized properties; new buildings in lease-up start lower. |
| Commercial office | about 80–90% | Strongly market-dependent; some markets sit well below this range. |
| Hospitals (bed occupancy) | about 65–85% | Planning guidance often avoids sustained levels near the top of the range, which leaves little surge capacity. |
| Self-storage | about 85–92% | Stabilized facilities; varies by region and by facility age. |
| Parking (garages and lots) | varies widely, often 70–90% at peak | Depends on location, time of day and pricing; average occupancy over 24 hours is usually lower than peak occupancy. |
Always compare your result with local, same-type, same-period benchmarks rather than a single global number.
Occupancy Scenarios Compared
Each row uses \(\text{Occupancy Rate} = \frac{\text{Occupied}}{\text{Total}} \times 100\%\), \(\text{Vacant} = \text{Total} - \text{Occupied}\), and \(\text{Vacancy Rate} = 100\% - \text{Occupancy Rate}\).
| Scenario | Occupied | Total | Vacant | Occupancy rate | Vacancy rate |
|---|---|---|---|---|---|
| 50-room hotel | 30 | 50 | 20 | 60% | 40% |
| 120-unit apartment building | 114 | 120 | 6 | 95% | 5% |
| 200-bed hospital | 150 | 200 | 50 | 75% | 25% |
| 80-space car park | 52 | 80 | 28 | 65% | 35% |
| 400-unit self-storage facility | 348 | 400 | 52 | 87% | 13% |
Worked check for the apartment building: \(\frac{114}{120} \times 100\% = 0.95 \times 100\% = 95\%\), so vacancy is \(100\% - 95\% = 5\%\), or 6 units.
Interpreting Your Occupancy Rate
- Low (below about 60%): Demand may be weak relative to capacity, or the period may be off-season. Fixed costs are spread over fewer paying units, so vacancy is costly. Low occupancy can also reflect a new property still ramping up.
- Mid (about 60–80%): Common in sectors with variable demand, such as hotels. Capacity is available for peaks while a reasonable share of units is in use.
- High (above about 90%): Demand is strong relative to supply. This can signal pricing power and room to raise rates, but it can also mean capacity is constrained, with little room for turnover, maintenance, surges or additional customers. In hospitals, sustained very high bed occupancy is generally associated with reduced flexibility.
Limits of the metric
- It ignores price and revenue. A full property sold at deep discounts can earn less than a less-full one at higher rates. In hotels, compare with ADR (average daily rate) and RevPAR (revenue per available room, equal to ADR × occupancy rate).
- Point-in-time vs. period averages. Occupancy on one night or one day can differ greatly from a monthly or annual average. Make sure you compare like with like.
- Seasonality. Benchmarks shift by season, day of week and local events, so compare with the same period in prior years or with similar properties.
- Definition of "available." Units that are out of service or under renovation may or may not be counted in the total, which changes the result.
This is general information to help you read the number, not financial or investment advice.
FAQ
What is a good occupancy rate? It varies by industry. Many hotels target 65–80%, while long-term rentals often aim for 95%+ to stay profitable. Compare against your market and break-even point.
Can occupancy exceed 100%? Not in a standard count — if occupied exceeds total available you've likely mismeasured. Double-bookings should be handled separately.
How is this different from utilization rate? Occupancy measures whether a unit is taken at a point in time; utilization often factors in time (e.g., room-nights sold over room-nights available across a period).