What Is the Price per Square Meter Calculator?
This calculator gives you the cost of a single square meter (m²) from a total price and a known floor or land area. It is a universal unit-rate tool used worldwide to compare property prices, rent, flooring, tiling, land plots and any item priced by area. Expressing a deal as price per square meter makes two differently sized options directly comparable.
How to Use It
Enter the total price (the full amount paid or asked) and the area in square meters. The calculator divides the price by the area and returns the rate per m². The currency is whatever you enter — the result is in that same currency per square meter.
The Formula Explained
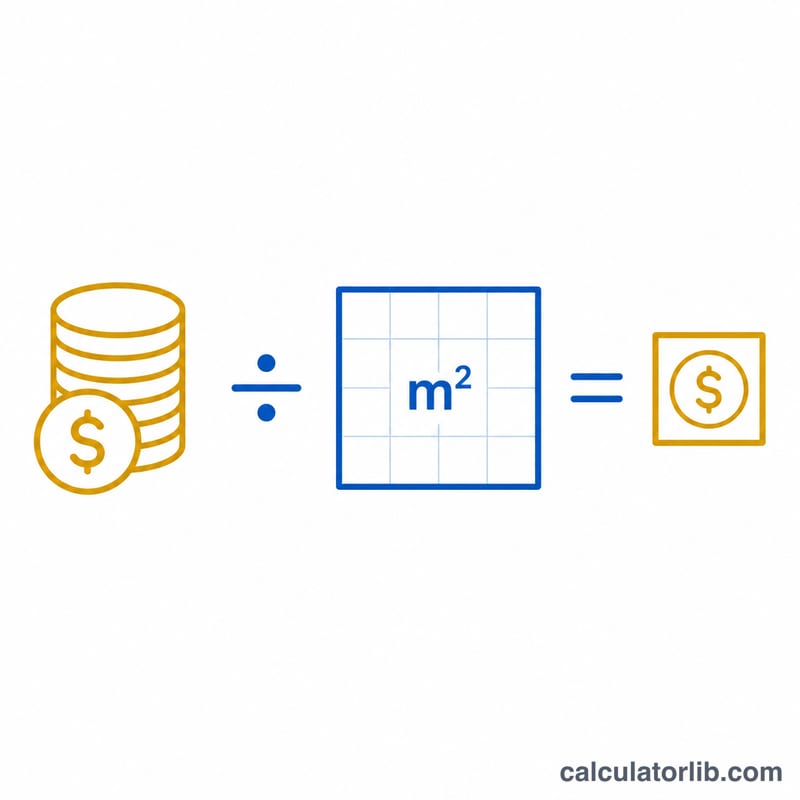
The math is a simple division:
$$\text{Price per m}^2 = \frac{\text{Total Price}}{\text{Area (m}^2\text{)}}$$If you know the price per m² and want the total, rearrange to: \(\text{Total} = \text{Price per m}^2 \times \text{Area}\). To convert from price per square foot, multiply by \(10.7639\).
Worked Example
Suppose an apartment costs $250,000 and has a floor area of 100 m². The price per square meter is $$250{,}000 \div 100 = \$2{,}500 \text{ per m}^2.$$ A second apartment at $300,000 covering 130 m² works out to about $2,308 per m² — making the larger unit cheaper per square meter despite the higher sticker price.
Price per m² Across Typical Scenarios
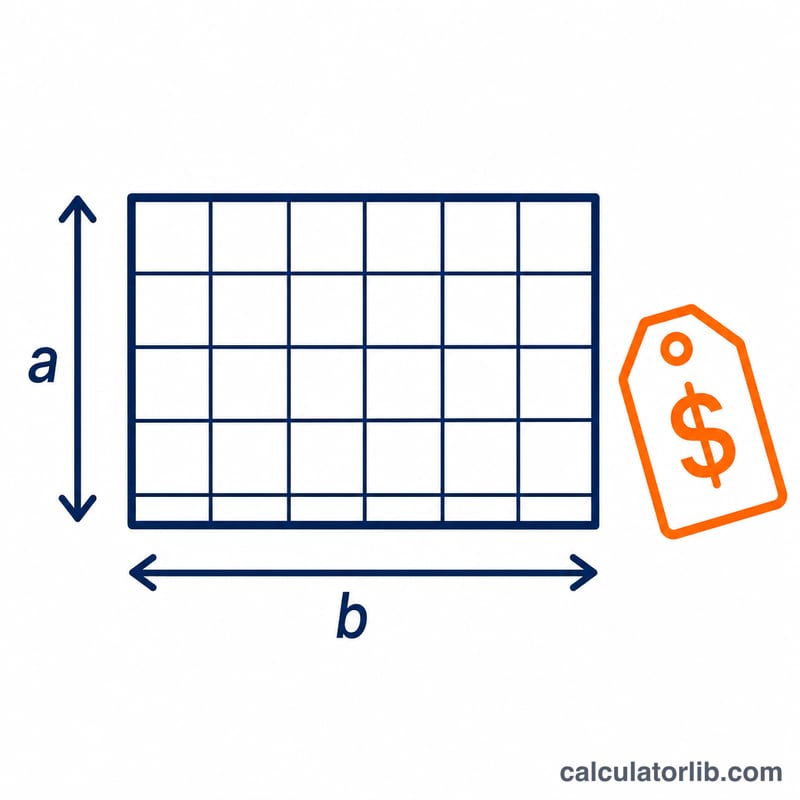
The unit rate is always the same simple division — total price divided by area:
$$\text{Price per m}^2 = \frac{\text{Total Price}}{\text{Area in m}^2}$$What changes between scenarios is what "total price" means (a purchase price, a plot price, a monthly rent, or a contractor's quote) and which area definition is being used. The examples below use a generic currency symbol; they are illustrative figures, not market data for any particular city or country.
| Scenario | Total Price | Area (m²) | Price per m² |
|---|---|---|---|
| 2-bedroom apartment (purchase) | $250,000 | 100 | $2,500/m² |
| Larger apartment (purchase) | $300,000 | 130 | ≈ $2,308/m² |
| Office space (monthly rent) | $4,800 | 160 | $30/m² per month |
| Building land plot | $90,000 | 600 | $150/m² |
| Laminate flooring job (supply + fit) | $1,750 | 35 | $50/m² |
Worked check on the second row, substituting the numbers in full:
$$\frac{\$300{,}000}{130\ \text{m}^2} = \$2{,}307.69\ \text{per m}^2 \approx \$2{,}308\ \text{per m}^2$$Two cautions. First, the rent rows are per m² per month — multiply by 12 for an annual rate (here 30 × 12 = $360 per m² per year). Some markets quote office rent annually by default, so always confirm the period before comparing. Second, only compare like for like: the same currency, the same area basis (gross vs net — see the glossary), and the same inclusions (does the flooring rate include underlay and removal of the old floor? does the rent include service charges or tax?). A lower headline rate quoted on gross area can easily be the more expensive deal.
Area and Price Unit Conversions
If your figures arrive in square feet, acres, or a local unit, convert first, then divide. The area factors below are exact-to-rounding definitions used internationally (the international foot and yard, and the international acre).
Area units
| Unit | Equivalent |
|---|---|
| 1 m² | 10.7639 ft² |
| 1 ft² | 0.092903 m² |
| 1 yd² | 0.836127 m² |
| 1 are | 100 m² |
| 1 hectare | 10,000 m² |
| 1 acre | 4,046.86 m² |
| 1 tsubo (Japan) / ping (Taiwan) | 3.30579 m² |
Price-rate conversions
| You have | Do this | You get |
|---|---|---|
| Price per ft² | × 10.7639 | Price per m² |
| Price per m² | ÷ 10.7639 | Price per ft² |
| Price per m² | × 10,000 | Price per hectare |
| Price per m² | × 4,046.86 | Price per acre |
| Rent per m² per month | × 12 | Rent per m² per year |
Why the direction flips: converting an area from m² to ft² multiplies by 10.7639, but converting a price per unit area from per-ft² to per-m² also multiplies by 10.7639 — because a square metre contains about 10.76 square feet, so it costs about 10.76 times as much. The rate moves the opposite way from the number of square metres. A quick sanity check: $200/ft² × 10.7639 ≈ $2,153/m², and the larger unit must carry the larger price.
Note also that tsubo and ping are national/regional units (Japan and Taiwan respectively) and are not used elsewhere; hectares and acres are normally used for land rather than built floor area.
Key Terms Explained
- Total price — the amount entered on top of the division: a purchase price, an asking price, a contractor's quote, or the rent for one defined period (usually a month). Be explicit about whether it includes tax, fees, or service charges.
- Area (m²) — the surface measurement entered underneath. One square metre is a square 1 m × 1 m.
- Gross / built-up area — area measured to the outer face of the external walls, including internal walls, columns, and often a share of corridors, lobbies, or stairwells.
- Net internal / usable / carpet area — the floor space actually inside the walls that you can walk on and furnish. "Carpet area" is the common term for this in India; "net internal area" is typical in UK practice.
- Saleable area — a basis used in some markets (notably Hong Kong and parts of Asia) in which each unit is charged for its own space plus an allocated share of common areas.
- Land area vs floor area — land area is the footprint of the plot; floor area is the constructed space inside a building, summed over all storeys. A three-storey house on a 200 m² plot may have roughly 300 m² of floor area, and the two produce very different per-m² rates.
- Price per m² (unit rate) — total price ÷ area; the figure this calculator returns, used to compare properties, plots, or quotes of different sizes.
- Rent per m² per month vs per year — the same rent expressed over different periods; multiply the monthly rate by 12 for the annual one. Residential leases are often quoted monthly, commercial leases annually, and conventions differ by country.
- Loading / common-area factor — the percentage added to net area to reach gross or saleable area. A 20% loading means 100 m² of usable space is marketed as 120 m².
Caution: quoting the same property on gross rather than net area typically changes the per-m² figure by roughly 10–25%, so a "cheaper" property may simply be measured on a more generous basis. Always confirm which area definition each figure uses before comparing rates, and check which measurement standard (for example RICS/IPMS in the UK, or local building-code definitions) applies in the market you are looking at.
House prices: how fast they are rising
Official house price indexes for the United States, the United Kingdom and Europe, updated automatically. An index follows the price of comparable homes over time, so the changes compare like with like.
- United States · 1 year
- +2.1%
- United States · 5 years
- +33.4%
- As of
- 2026-Q2
Mortgage rates
What a new home loan costs on average, as banks report it to the European Central Bank. The change over 12 months is computed by CalculatorLib.
- Mortgage rate · Euro area (2026-09)
- 3.62% +0.31 pp since 2025-09
United States: states with the fastest and slowest growth (2026-Q2)
National: +2.1% over 1 year, +33.4% over 5 years.
| State | 1 year | 5 years |
|---|---|---|
| Fastest growth | ||
| Alaska | +8.3% | +37.0% |
| Vermont | +7.2% | +51.8% |
| Hawaii | +5.9% | +39.1% |
| West Virginia | +5.7% | +40.5% |
| Illinois | +5.5% | +43.9% |
| Slowest growth | ||
| New Mexico | −1.2% | +34.6% |
| Washington | −1.0% | +19.6% |
| Colorado | −0.6% | +15.7% |
| California | −0.3% | +17.1% |
| Oregon | +0.2% | +15.7% |
United Kingdom: average price by nation (2026-08)
| Area | Average price | 1 year |
|---|---|---|
| United Kingdom | £273,037 | +0.9% |
| England | £293,525 | +0.4% |
| Scotland | £198,397 | +2.9% |
| Wales | £216,363 | +3.1% |
| London | £554,430 | −2.2% |
Europe: house price change by country (2025)
EU average: +5.5% over 1 year.
| Country | 1 year | 5 years |
|---|---|---|
| Hungary | +18.3% | +105.3% |
| Portugal | +17.6% | +71.0% |
| Bulgaria | +14.6% | +81.4% |
| Croatia | +13.9% | +73.9% |
| Spain | +12.7% | +41.6% |
| Slovakia | +12.4% | +40.8% |
| Czechia | +10.4% | +59.5% |
| Lithuania | +9.8% | +82.8% |
| Netherlands | +8.5% | +49.3% |
| Latvia | +7.6% | +46.8% |
| Ireland | +7.5% | +46.3% |
| Denmark | +7.5% | +25.1% |
| Slovenia | +7.3% | +58.4% |
| Malta | +6.0% | +34.7% |
| Romania | +5.7% | +28.3% |
| Norway | +5.7% | +28.2% |
| Estonia | +5.2% | +66.2% |
| Iceland | +5.1% | +66.7% |
| Poland | +4.9% | +60.2% |
| Cyprus | +4.5% | +28.4% |
| Italy | +4.0% | +15.7% |
| Germany | +3.2% | +10.1% |
| Belgium | +3.2% | +22.7% |
| Austria | +2.5% | +23.3% |
| Luxembourg | +1.6% | +9.3% |
| Sweden | +1.0% | +9.3% |
| France | +0.7% | +9.1% |
| Finland | −2.3% | −6.2% |
Germany: house price change by type of district (2026-Q2)
Destatis publishes this index by type of district, not as one national figure; each change compares with 2025-Q2.
| Type of district | 1 year |
|---|---|
| Metropolises (the 7 largest cities) | −0.4% |
| Other large independent cities | +2.0% |
| Urban districts | +0.5% |
| Rural districts with signs of densification | −1.8% |
| Sparsely populated rural districts | −0.6% |
Latest figure: 2026-Q2 Data last updated 2026-11-02 · current
Source: Federal Housing Finance Agency (FHFA), House Price Index FHFA copyright notice; Contains HM Land Registry data © Crown copyright and database right Open Government Licence v3.0; Eurostat, House price index (prc_hpi_a) Eurostat reuse policy (CC BY 4.0); © Statistisches Bundesamt (Destatis), 2026 Datenlizenz Deutschland – Namensnennung – Version 2.0; European Central Bank, MFI interest rate statistics ECB reuse policy
Percentage changes are computed by CalculatorLib from the published indexes.
Source details and methodology
- Federal Housing Finance Agency (FHFA), House Price Index
- Contains HM Land Registry data © Crown copyright and database right
- Eurostat, House price index (prc_hpi_a)
- © Statistisches Bundesamt (Destatis), 2026 — Häuserpreisindex nach siedlungsstrukturellen Kreistypen
- European Central Bank, MFI interest rate statistics
FAQ
Does this work for rent? Yes. Use the monthly or annual rent as the total price to get rent per square meter.
What if my area is in square feet? Convert first: \(1\) square meter \(= 10.7639\) square feet, so divide square feet by \(10.7639\) to get square meters.
Can I compare different currencies? Only if you convert all prices to the same currency first; otherwise the per-m² values are not comparable.