What is the printer ink cost per page?
The ink cost per page tells you how much you spend on ink or toner every time you print a single page. It turns the headline price of a cartridge into a number you can actually compare between printers, brands and high-yield versus standard cartridges. A cheap printer often hides an expensive running cost, so cost per page is the fairer way to judge long-term value.
How to use this calculator
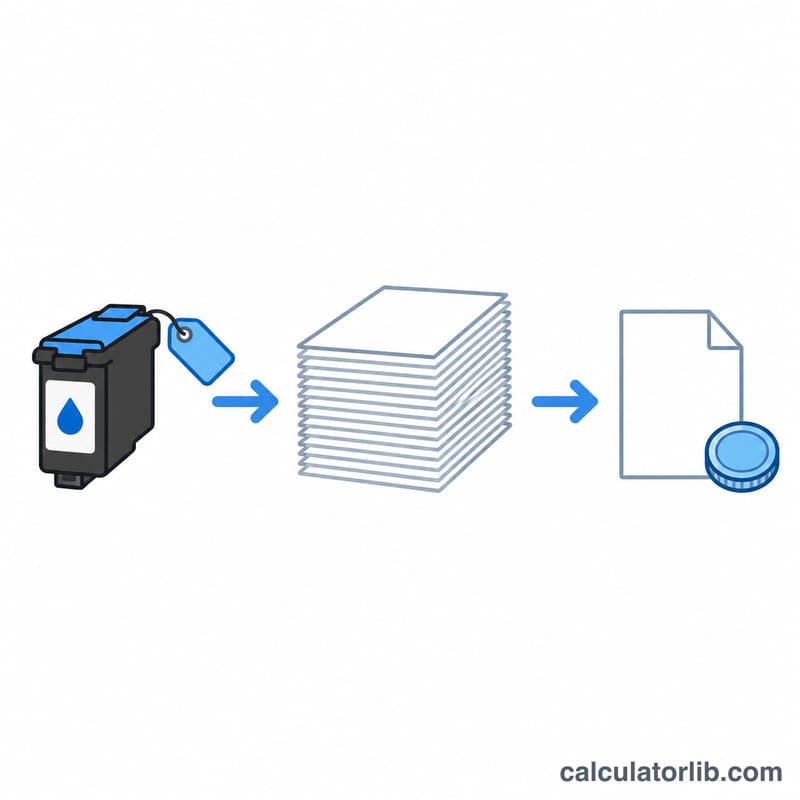
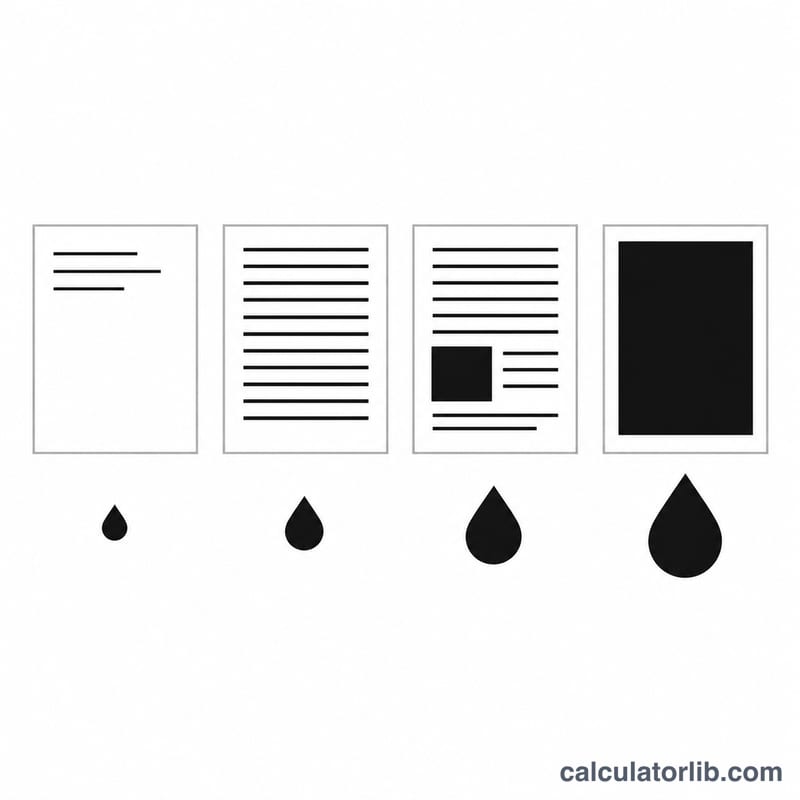
Enter the cartridge price, its rated page yield, the coverage that yield was measured at (usually 5%), and the coverage you actually print at. Plain text documents sit near 5%, while graphics, photos and bold layouts push coverage higher, which uses more ink and raises your real cost per page.
The formula explained
The base cost divides price by yield, then a coverage ratio scales it to your real usage. With \(P\) = cartridge price, \(Y\) = rated yield, \(C\) = your coverage and \(R\) = rated coverage:
$$\text{Cost/Page} = \frac{P}{Y} \times \frac{C}{R}$$Printing at double the rated coverage doubles your cost per page, because each page uses twice the ink.
Worked example
Suppose a cartridge costs $30, is rated for 600 pages at 5% coverage, and you print at 10% coverage. The base cost is:
$$\frac{\$30}{600} = \$0.05 \text{ per page}$$Scaling for the heavier coverage gives:
$$\$0.05 \times \frac{10}{5} = \$0.10 \text{ per page}$$Your effective yield drops to \(600 \times \tfrac{5}{10} = 300\) pages.
Typical Page Coverage by Document Type
Page coverage is the share of the printable area that ends up covered in ink or toner. Cartridge page yields are measured at a low standard coverage of about 5%. If your pages use more ink than that, you will get fewer pages from each cartridge and pay more per page. The table below gives rough coverage ranges for common document types. The multiplier column shows about how much more each page costs than the rated 5% page, assuming ink use rises in proportion to coverage.
| Document type | Approximate coverage | Cost multiplier vs. 5% rating |
|---|---|---|
| Plain text letter | ~5% | ~1× |
| Text with headings and bullets | ~5–10% | ~1–2× |
| Mixed text and charts | ~10–15% | ~2–3× |
| Presentation slides or heavy graphics | ~20–30% | ~4–6× |
| Full-page photo | up to ~100% | up to ~20× |
Where the 5% figure comes from: Manufacturers state yields using standard ISO/IEC test methods. ISO/IEC 19752 covers monochrome toner cartridges. ISO/IEC 24711 is the yield test method for inkjet cartridges, and ISO/IEC 24712 defines the set of test pages it uses. The test pages in these standards work out to roughly 5% coverage, so this calculator uses 5% as the default rated coverage. The rating is a way to compare cartridges, not a promise of how many pages you will get. Your own coverage depends on fonts, margins, images, colour use and print-quality settings. Cleaning cycles, how often you print and ink left in a cartridge that reports empty also lower the pages you actually get.
Example: A $30 cartridge is rated for 300 pages at 5% coverage, and you mostly print slides at about 20% coverage:
$$\text{Cost per Page} = \frac{\$30}{300} \times \frac{20\%}{5\%} = \$0.10 \times 4 = \$0.40$$At this coverage each page costs about $0.40, four times the $0.10 you would pay at the rated 5%. The cartridge would also run out after roughly 300 × 5 / 20 = 75 pages.
FAQ
What coverage should I use? Plain text is about 5%; mixed documents 10-15%; photos much higher.
Why is my cost higher than advertised? Manufacturers quote yields at 5% coverage, so heavier pages naturally cost more.
Does this include paper or electricity? No, it covers ink or toner only; add those separately for a total running cost.