What it is
The Irrigation Runtime Calculator tells you how many minutes to run a sprinkler, drip line, or garden hose to deliver the exact amount of water your plants need. Instead of guessing, you enter the area you are watering, the water requirement (depth), and the flow rate of your system, and the tool returns a precise runtime in both minutes and hours, along with the total volume of water used.
The formula explained
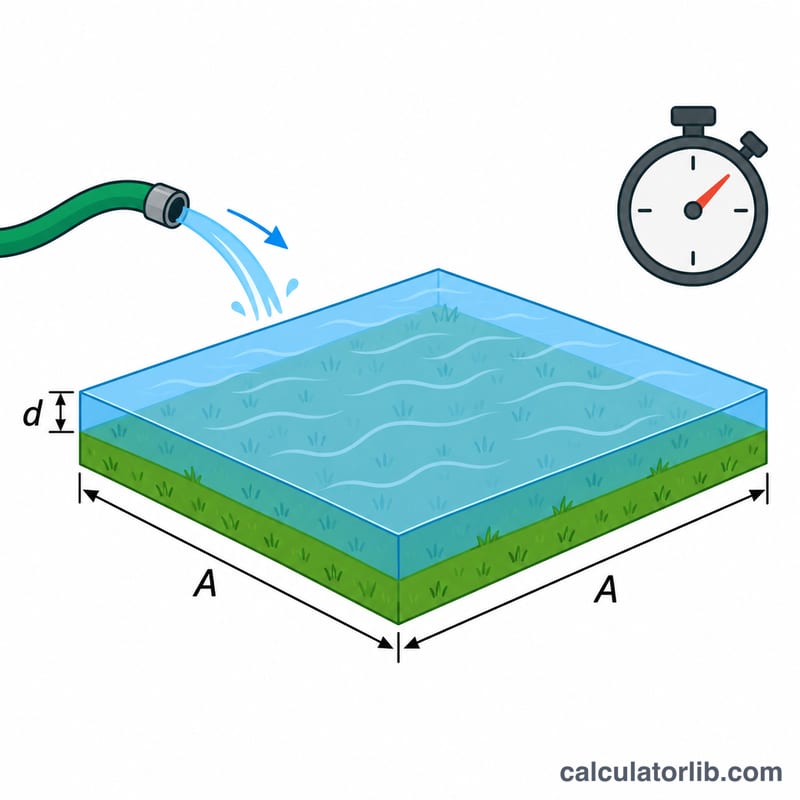
The calculation rests on a simple physical fact: applying \(1\,\text{mm}\) of water over \(1\,\text{m}^2\) of ground uses exactly \(1\) liter of water. The runtime is therefore:
$$ t = \frac{A \times D}{Q} $$where \(A\) = area in square meters, \(D\) = water depth in millimeters, \(Q\) = flow rate in liters per minute, and \(t\) = runtime in minutes. The numerator \(A \times D\) is the total water volume in liters.
How to use it
Measure the garden bed or lawn area in square meters. Look up the water requirement for your crop and season, commonly \(10\) to \(30\,\text{mm}\) per irrigation. Find your flow rate from the system spec sheet or by timing how long it takes to fill a known container. Enter all three values and read the runtime.
Worked example
Suppose you water a \(100\,\text{m}^2\) lawn that needs \(25\,\text{mm}\) of water, using a system that delivers \(20\,\text{L/min}\). The volume needed is
$$ V = 100 \times 25 = 2500\,\text{L} $$and the runtime is
$$ t = \frac{2500}{20} = 125\,\text{min} \approx 2.08\,\text{h}. $$Typical Flow Rates and Application Efficiency by Irrigation System
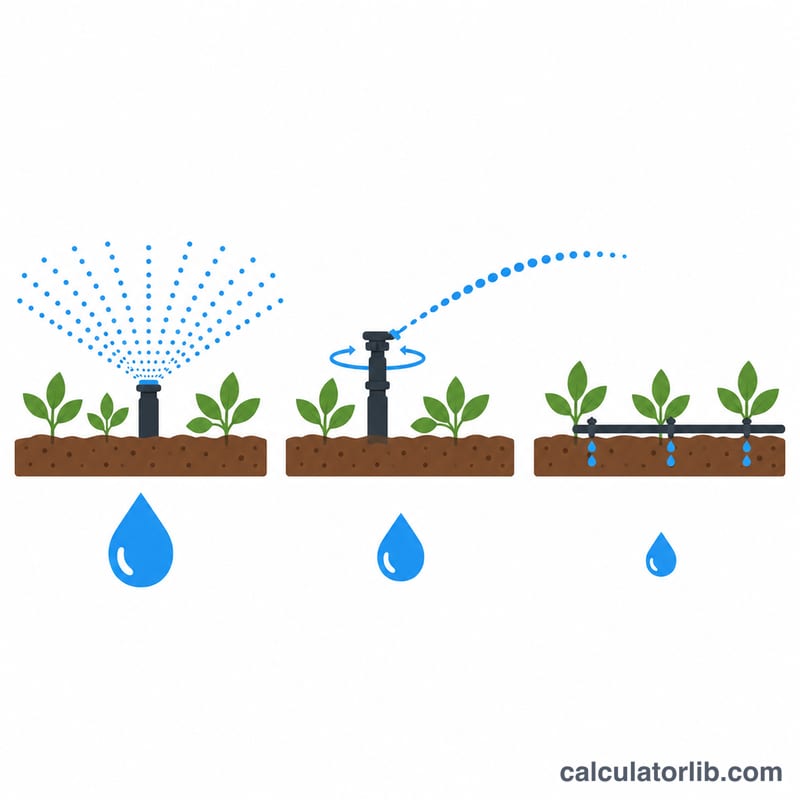
The calculator needs your system's flow rate. If you don't know it, the table below gives typical ranges for common irrigation hardware. The ranges are approximate. They match figures commonly published by the Irrigation Association and US university extension services, such as manufacturer charts and extension irrigation guides. Those sources usually give flow in US units (gallons per hour or gallons per minute), so the values here are converted to metric and rounded. Your actual figures depend on the nozzle, operating pressure, spacing and maintenance, so check the manufacturer's chart for your hardware.
| System | Typical flow per emitter / head | Typical precipitation rate (mm/h) | Typical application efficiency |
|---|---|---|---|
| Drip emitters | about 2–8 L/h per emitter (0.5–2 gph) | low: roughly 2–20 mm/h, depending on emitter spacing | about 85–90% |
| Micro-sprinklers / micro-sprays | about 20–200 L/h per head | roughly 3–15 mm/h | about 70–85% |
| Fixed spray heads | about 1–8 L/min per head (0.3–2 gpm) | high: roughly 25–50 mm/h (1–2 in/h) | about 50–70% |
| Rotor heads (gear-driven / rotary nozzles) | about 2–40 L/min per head, depending on nozzle and radius | roughly 8–20 mm/h (0.3–0.8 in/h) | about 65–80% |
| Garden hose with hose-end sprinkler | about 10–25 L/min total, depending on pressure and hose diameter | highly variable: roughly 5–25 mm/h | about 50–70% (highly variable) |
Which flow rate to enter: enter the total flow of the zone that waters the area, not the flow of a single head. For example, 10 spray heads at 2 L/min each give 20 L/min. To measure a hose or a single zone directly, time how long it takes to fill a bucket of known volume.
How to apply efficiency: not all of the water applied reaches the root zone. Some is lost to evaporation, wind drift, runoff and uneven coverage. The calculator's basic runtime assumes 100% efficiency (1 mm of water over 1 m² equals 1 L). To compensate, divide the runtime by the efficiency written as a decimal:
$$t_{\text{adj}} = \frac{t}{E}$$Example: a 100 m² lawn needs 25 mm, and the zone delivers 20 L/min. The basic runtime is \(t = \frac{100 \times 25}{20}\) = 125 minutes. With spray heads at 70% efficiency, \(t_{\text{adj}} = \frac{125}{0.70} \approx 178.6\) minutes, or about 3 hours. You would normally split that time across several days or cycles, as described below.
Typical Water Requirements by Plant Type and Season
The table below gives typical weekly water depths, counting rain plus irrigation, for established plants. Use the lower end in cool or humid weather and the upper end during peak summer heat. The figures are general rules of thumb drawn from temperate-climate extension guidance, much of it from the United States. The well-known "about 1 inch (25 mm) per week" lawn guideline is a US extension rule of thumb, for example. These are approximate starting points. Your actual needs depend on local climate, sun exposure, wind, soil and plant species.
| Plant type | Cool weather (mm/week) | Typical / moderate (mm/week) | Peak summer heat (mm/week) |
|---|---|---|---|
| Cool-season turf (e.g., Kentucky bluegrass, tall fescue, ryegrass) | about 10–20 | about 25 | about 30–40 |
| Warm-season turf (e.g., bermudagrass, zoysia, St. Augustine) | about 5–15 | about 20 | about 25–35 |
| Vegetable gardens | about 15–25 | about 25 | about 40–50 |
| Shrubs and perennials (established) | about 5–15 | about 15–25 | about 25–35 |
| Trees (established, over the root zone) | about 5–15 | about 15–25 | about 25–40 |
Newly planted turf, shrubs and trees need lighter, more frequent watering until their roots establish. Drought-adapted plants often need much less than the figures above.
ET-based guidance: many agricultural extension services recommend sizing irrigation from evapotranspiration (ET) rather than fixed rules. Plant water use is estimated as reference ET multiplied by a crop or landscape coefficient:
$$D_{\text{week}} \approx ET_0 \times K_c \times 7$$Here \(ET_0\) is the daily reference evapotranspiration in mm/day, which many regional weather networks publish, and \(K_c\) is the plant coefficient. As one regional example, University of California guidance commonly uses about 0.8 for cool-season turf and about 0.6 for warm-season turf. With \(ET_0 = 5\) mm/day and \(K_c = 0.8\): \(5 \times 0.8 \times 7 = 28\) mm/week. Coefficients and ET values vary by region, so use figures from your local extension service or weather network where available.
Soil type changes the schedule: the weekly depth can stay the same while the timing changes. Sandy soil holds little water, so it needs smaller, more frequent applications, for example 2–3 times per week. Clay soil holds more water but absorbs it slowly, so it suits larger, less frequent applications, often delivered with cycle-and-soak. Loam falls in between.
Practical Tips for Applying Your Runtime
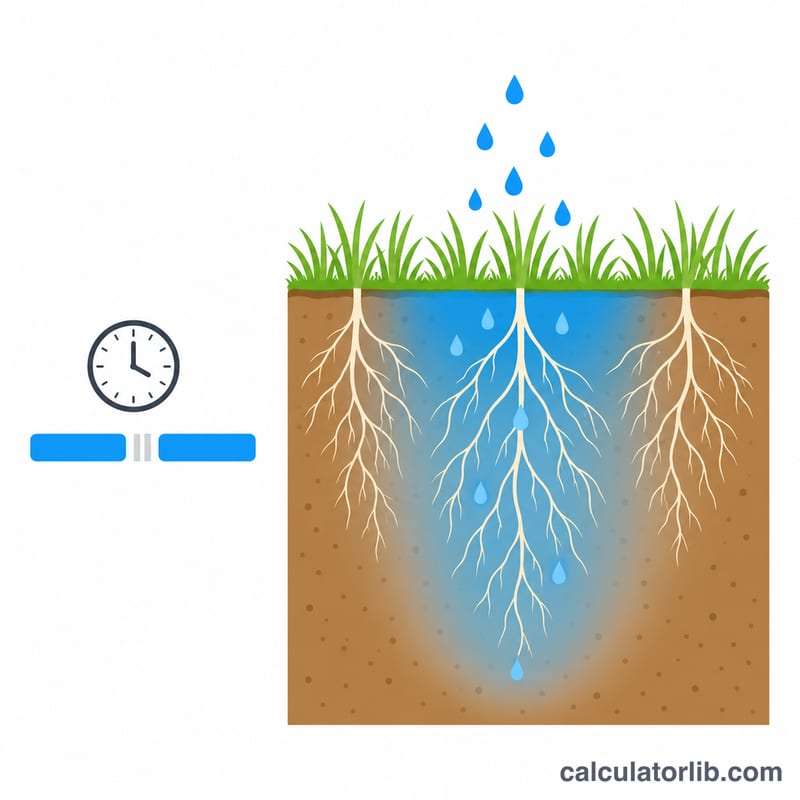
- Use cycle-and-soak when water runs off. If the system's precipitation rate exceeds the soil's infiltration rate, water pools and runs off before it soaks in. This is common with fixed spray heads (often 25–50 mm/h) on clay soils, which may absorb only a few mm per hour. Split the total runtime into 2–3 shorter cycles with roughly 30–60 minutes of soak time between them. For example, a 30-minute runtime becomes 3 cycles of 10 minutes each. The total water applied stays the same, but more of it reaches the roots.
- Water in the early morning. Watering before or around sunrise usually means cooler temperatures, lower wind and less evaporation. Foliage also dries during the day, which reduces disease risk compared with evening watering.
- Round up to the controller's increment. Most controllers set runtimes in whole minutes. Round the calculated runtime up, not down, so the full depth is applied. For example, enter 13 minutes rather than 12.4. When the runtime is split into cycles, round each cycle up.
- Subtract rainfall from the required depth. Rain that fell during the week counts toward the target, so use \(D_{\text{net}} = D - \text{rain}\). Suppose a lawn needs 25 mm this week and a rain gauge recorded 10 mm. Enter 15 mm. For 100 m² at 20 L/min, that gives \(t = \frac{100 \times 15}{20}\) = 75 minutes, before any efficiency adjustment. Very light showers of a few mm may mostly evaporate, so count them conservatively. Many smart controllers and rain sensors make this adjustment automatically.
- Run a catch-cup test. Nameplate flow rates can differ from what actually reaches the ground. Place several straight-sided cups or cans evenly across the zone and run it for a set time, such as 15 minutes. Then measure the average water depth. The actual application rate is:$$PR\ (\text{mm/h}) = \frac{\text{average depth (mm)} \times 60}{\text{test time (min)}}$$For example, 6 mm collected in 15 minutes gives \(\frac{6 \times 60}{15} = 24\) mm/h. Large differences between cups show uneven coverage, which you can often fix by adjusting heads or nozzles before increasing the runtime.
- Check results and adjust. Use the calculated runtime as a starting point. Watch for wilting, runoff, puddling or soggy soil, and adjust the depth or runtime as the season changes.
FAQ
What if my flow rate is in gallons per minute? Convert to liters per minute by multiplying by \(3.785\).
Does this account for irrigation efficiency? No, it assumes all delivered water reaches the root zone. For systems with losses, divide the runtime by your efficiency factor (for example \(0.75\)) to compensate.
How do I find the water requirement? Local agricultural extensions publish crop water needs, often expressed as millimeters per day or per week.