What this irrigation design calculator does
This calculator turns the basic facts of a garden, orchard or small farm plot into a workable irrigation layout. From the irrigated area, peak crop water demand, application efficiency, emitter flow and water supply it estimates how many emitters you need, how many zones to split them into, how long each zone must run and how much pressure the mainline pipe will lose to friction. Units are metric (m², mm, L/h, L/min).
How to use it
Enter the area and the peak daily water demand in mm/day (from local evapotranspiration data). Add the efficiency of your system, typically 75-90% for drip and 65-80% for sprinklers. Provide the flow per emitter, the area each emitter covers, and the flow your tap, pump or well can deliver. Finally enter the mainline length, inner diameter and Hazen-Williams C (about 140-150 for new polyethylene or PVC).
The method explained
The gross depth is the net demand divided by efficiency. One millimetre over one square metre equals one litre, so the daily volume is area times gross depth. Emitters are counted by dividing the area by the coverage per emitter. The number per zone is limited by supply flow:
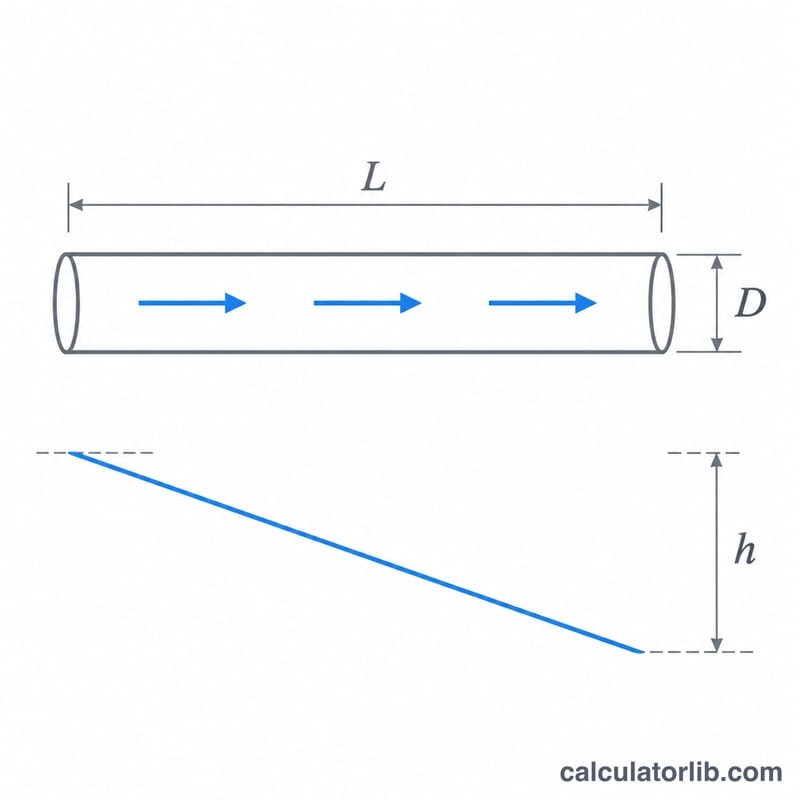
$$Z = \left\lceil \frac{N}{\lfloor Q_s / q_e \rfloor} \right\rceil$$where \(N\) = total emitters, \(Q_s\) = supply flow and \(q_e\) = flow per emitter. Run time per zone equals gross depth divided by the application rate (emitter flow divided by coverage area). Friction loss uses Hazen-Williams:
$$h_f = \frac{10.67 \, L \, Q^{1.852}}{C^{1.852} \, d^{4.87}}$$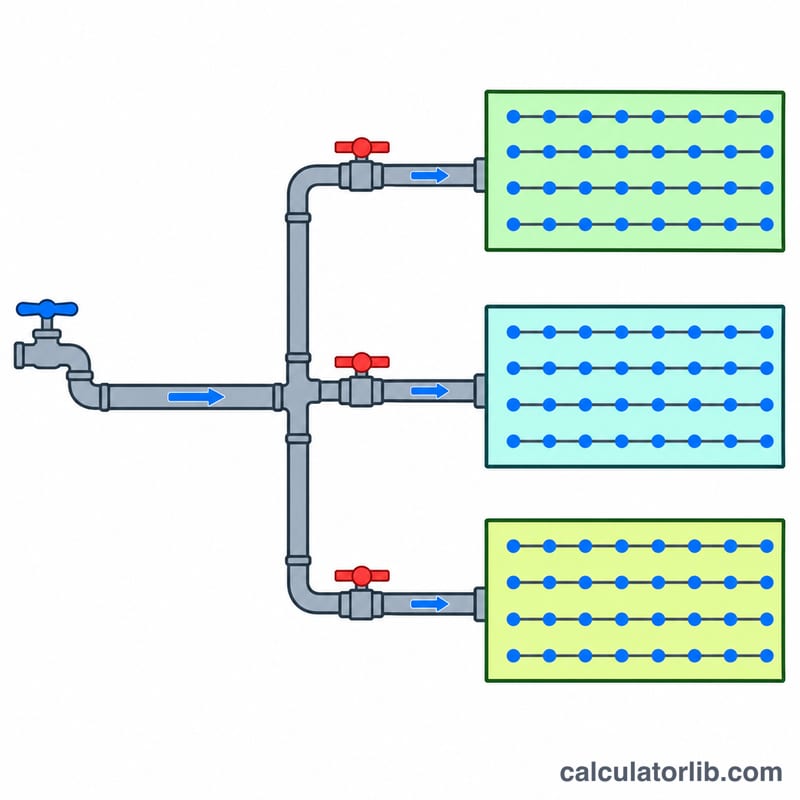
Worked example
A 500 m² lawn needs 5 mm/day at 80% efficiency, so the gross depth is:
$$\frac{5}{0.8} = 6.25\,\text{mm/day}$$Sprinklers of 600 L/h (10 L/min) cover 25 m² each, so \(N = 500/25 = 20\). With a 40 L/min supply, 4 sprinklers fit per zone, giving 5 zones. The application rate is 600/25 = 24 mm/h, so each zone runs:
$$\frac{6.25}{24} \times 60 = 15.6\,\text{min}$$Total daily run time is about 78 minutes, well inside a 4-hour window.
Hazen-Williams C Values by Pipe Material
The Hazen-Williams coefficient \(C\) describes how smooth the inside of a pipe is. A higher \(C\) means lower friction loss in the formula \(h_f = \dfrac{10.67\, L\, Q^{1.852}}{C^{1.852}\, D^{4.87}}\). Enter the value that matches your mainline in the Hazen-Williams C field.
| Pipe material | Typical C value |
|---|---|
| New PE / HDPE | 140-150 |
| PVC | 140-150 |
| Aged PVC / PE | about 130-140 |
| New galvanized steel | about 120 |
| Aged galvanized steel | 80-100 |
| Cast iron | 100-130 |
| Ductile iron, cement-lined | about 140 |
Note: C drops with age, scale build-up and corrosion, especially in metal pipes. These are commonly published design values, not guarantees. For a conservative design, use a value toward the lower end of the range, or the manufacturer's figure for your pipe.
Typical Efficiency, Emitter Flow and Peak Demand Ranges
| Parameter | Typical range |
|---|---|
| Application efficiency, drip | 85-95% |
| Application efficiency, micro-sprinklers | 75-90% |
| Application efficiency, sprinklers | 65-80% |
| Application efficiency, surface irrigation | 50-70% |
| Emitter flow, drip | 1-8 L/h |
| Emitter flow, micro-sprinklers | 20-200 L/h |
| Emitter flow, pop-up sprinklers | 200-1000+ L/h |
| Peak crop water demand | about 3-8 mm/day, depending on climate and crop |
| Design flow velocity in pipes | 0.9-1.5 m/s |
| Operating pressure, drip | 100-200 kPa |
| Operating pressure, sprinklers | 200-400 kPa |
These are general planning ranges. Local evapotranspiration (ET) data and the manufacturer's specifications for your emitters, filters and pipe always take precedence over them. Velocities above about 1.5 m/s raise friction loss sharply and increase the risk of surge (water hammer).
Scenario Comparison: Drip vs Sprinkler vs Pipe Size
All scenarios use the same 500 m² area, peak demand of 5 mm/day, a supply of 60 L/min, a 50 m mainline and C = 140. Sprinklers: 80% efficiency, 600 L/h per sprinkler, 25 m² coverage each. Drip: 90% efficiency, 4 L/h per emitter, 1 m² coverage each. The friction loss is for the mainline carrying one zone's flow, with Hazen-Williams applied as in the formula above. It excludes lateral and fitting losses.
| Scenario | Emitters \(N_e\) | Zones \(N_z\) | Flow per zone | Run time per zone | Total daily run time | Mainline | Velocity | Friction loss \(h_f\) |
|---|---|---|---|---|---|---|---|---|
| 1. Sprinklers, 25 mm | 20 | 4 | 50 L/min | 15.6 min | 62.5 min | 25 mm | 1.70 m/s | 7.11 m |
| 2. Sprinklers, 32 mm | 20 | 4 | 50 L/min | 15.6 min | 62.5 min | 32 mm | 1.04 m/s | 2.14 m |
| 3. Drip, 25 mm | 500 | 1 | 33.3 L/min | 83.3 min | 83.3 min | 25 mm | 1.13 m/s | 3.36 m |
| 4. Drip, 32 mm | 500 | 1 | 33.3 L/min | 83.3 min | 83.3 min | 32 mm | 0.69 m/s | 1.01 m |
How the numbers arise
- Sprinklers: \(d_g = 5 / 0.80 = 6.25\) mm/day. \(N_e = \lceil 500/25 \rceil = 20\). \(q_e = 600/60 = 10\) L/min, so \(\lfloor 60/10 \rfloor = 6\) sprinklers fit per zone and \(N_z = \lceil 20/6 \rceil = 4\). Each zone runs 5 sprinklers (50 L/min), and \(t_z = 6.25 \times 25 / 600 = 0.260\) h ≈ 15.6 min.
- Drip: \(d_g = 5 / 0.90 = 5.56\) mm/day. \(N_e = 500\) and \(q_e = 4/60 = 0.0667\) L/min, so \(\lfloor 60/0.0667 \rfloor = 900\) emitters fit per zone and \(N_z = 1\). Then \(t_z = 5.56 \times 1 / 4 = 1.39\) h ≈ 83.3 min.
- Pipe size: friction loss scales with \(D^{-4.87}\). Going from 25 mm to 32 mm cuts the loss by about two thirds (7.11 m to 2.14 m for the sprinkler flow) and brings the velocity under 1.5 m/s.
Takeaway: drip needs one zone but a longer run, while sprinklers need several short zones. Because friction loss rises steeply with flow, the larger pipe matters most for the higher-flow sprinkler zones. Values are rounded and for illustration only; check your own design against local ET data and manufacturer specifications.
FAQ
What water velocity is acceptable?
Keep velocity below about 1.5 m/s to limit pressure surges and friction. If the result is higher, use a larger pipe.
Does this include elevation or fittings?
No. Only straight-pipe friction on the mainline is calculated. Add elevation change and fitting losses separately when sizing the pump.
Why does the tool warn about my irrigation window?
If total run time exceeds the hours you can irrigate, you need more supply flow, fewer zones or a more efficient system.