What this calculator does
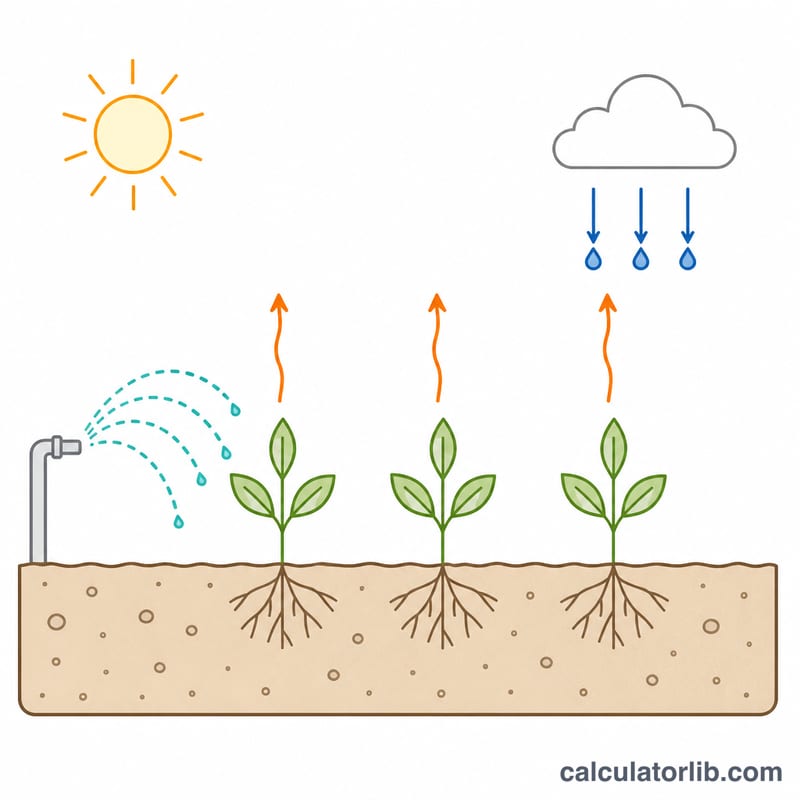
This tool estimates how much irrigation water a field actually needs over a chosen period. It follows the standard FAO-56 approach used worldwide: start from reference evapotranspiration \(ET_0\), scale it with a crop coefficient \(K_c\), subtract the rain the crop can really use, then divide by the efficiency of your irrigation system to get the volume you must pump or deliver. Because it is based on physical water balance rather than any national rule, it applies in any country.
How to use it
Enter the field area (hectares, acres or square metres), pick the crop and growth stage to set \(K_c\) (or type a custom value), then enter \(ET_0\) in mm/day from a local weather station or forecast, the effective rainfall in mm/day, your system efficiency (drip 85-95%, sprinkler 70-80%, surface/furrow 50-65%) and how many days the period covers.
The formula explained
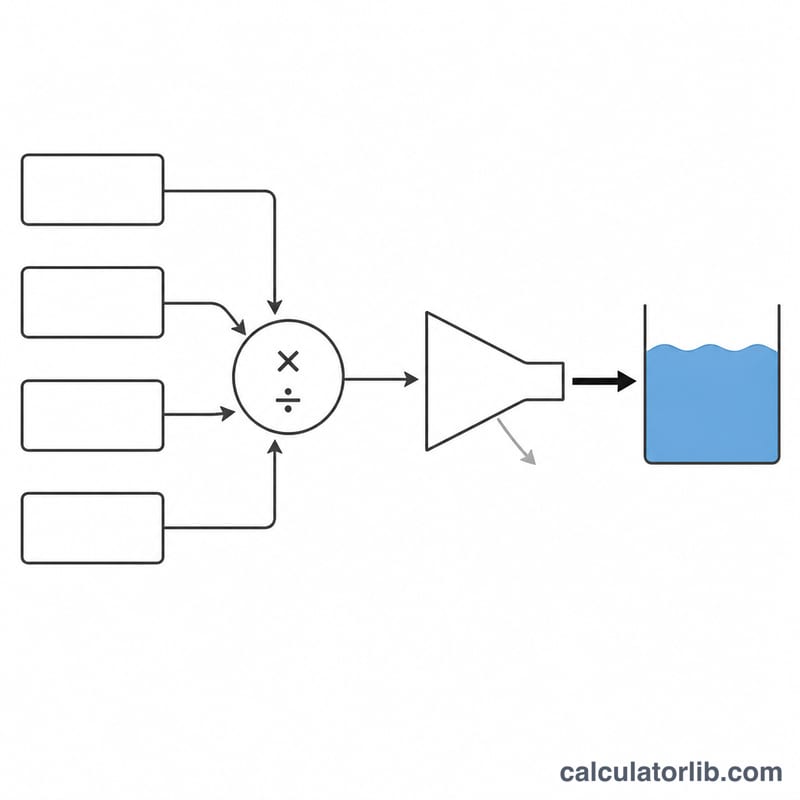
Crop water use is \(ET_c = ET_0 \times K_c\). The net requirement is \(ET_c - P_e\), never below zero. Dividing by efficiency \(E_a\) gives the gross depth, and depth becomes volume through the area:
$$V = \frac{ET_0 \times K_c - P_e}{E_a} \times A \times D \times 0.001$$Here \(A\) = area in m², \(D\) = days, \(P_e\) = effective rainfall in mm/day and \(E_a\) = efficiency as a decimal. The factor 0.001 converts millimetres to metres, so 1 mm over 1 ha = 10 m³.
1 mm of water applied over 1 hectare equals 10 cubic metres (10,000 litres). Effective rainfall is the share of rain actually stored in the root zone, not total rainfall.
Worked example
A 2 ha wheat field at mid season (\(K_c = 1.15\)), with \(ET_0 = 6\) mm/day, 1 mm/day of effective rain, a 75% efficient sprinkler system, over 7 days:
$$ET_c = 6 \times 1.15 = 6.9\,\text{mm/day}$$$$I_{net} = 6.9 - 1 = 5.9\,\text{mm/day}$$$$I_{gross} = \frac{5.9}{0.75} = 7.87\,\text{mm/day}$$$$V = 7.87 \times 20000 \times 0.001 \times 7 \approx 1101\,\text{m}^3$$Crop Coefficient (Kc) Values by Crop and Growth Stage
The single crop coefficient \(K_c\) converts reference evapotranspiration into crop evapotranspiration, \(ET_c = K_c \cdot ET_0\). The values below are the indicative single crop coefficients published in FAO Irrigation and Drainage Paper No. 56 (Allen et al., 1998), Table 12, together with representative stage lengths from the same publication (Table 11). FAO-56 is an international guideline, not a national standard, but the tabulated values are generic figures for a sub-humid climate and still need local adjustment.
| Crop | Kc ini | Kc mid | Kc end | Stage lengths, init / dev / mid / late (days) | Approx. total period (days) |
|---|---|---|---|---|---|
| Wheat, winter (cold winter, non-frozen soil at planting) | 0.70 (0.40 on frozen soil) | 1.15 | 0.25–0.40 | 160 / 75 / 75 / 25 | ~335 |
| Wheat, spring | 0.30 | 1.15 | 0.25–0.40 | 15–20 / 25 / 50–60 / 30 | 120–135 |
| Maize, field (grain) | 0.30 | 1.20 | 0.60 (0.35 if harvested dry) | 30 / 40 / 50 / 30–50 | 150–180 |
| Rice (paddy) | 1.05 | 1.20 | 0.70–0.90 | 30 / 30 / 60 / 30 | ~150 |
| Potato | 0.50 | 1.15 | 0.75 | 25–30 / 30–35 / 45–50 / 30 | 130–145 |
| Tomato | 0.60 | 1.15 | 0.70–0.90 | 30–35 / 40–45 / 40–70 / 25–30 | 135–180 |
| Cotton | 0.35 | 1.15–1.20 | 0.70–0.50 | 30 / 50 / 60 / 55 | ~195 |
| Alfalfa, for hay (individual cutting cycle) | 0.40 | 1.20 | 1.15 | 5 / 10 / 10 / 5 per cycle (first cycle longer) | ~30–40 per cut |
| Citrus, ~70 % canopy cover, no ground cover | 0.70 | 0.65 | 0.70 | 60 / 90 / 120 / 95 | 365 (perennial) |
| Olive, 40–60 % ground cover by canopy | 0.65 | 0.70 | 0.70 | 30 / 90 / 60 / 90 | ~270 + dormancy |
| Grape, table / raisin | 0.30 | 0.85 | 0.45 | 20 / 40 / 120 / 60 | ~240 |
| Onion, dry | 0.70 | 1.05 | 0.75 | 15 / 25 / 70 / 40 | ~150 |
| Soybean | 0.40 | 1.15 | 0.50 | 15–20 / 15–35 / 40–60 / 15–25 | 85–140 |
How to read the table. \(K_{c\,ini}\) applies from planting until roughly 10 % ground cover, \(K_{c\,mid}\) from effective full cover to the start of maturity, and \(K_{c\,end}\) at harvest. During the development and late-season stages \(K_c\) is obtained by linear interpolation between the neighbouring values.
Important caveats. \(K_{c\,mid}\) assumes a healthy, densely planted crop at effective full cover growing without water stress; stressed, patchy or young plantings use lower values (FAO-56 handles this with a water-stress coefficient \(K_s\) and a basal/evaporation split, \(K_c = K_{cb}K_s + K_e\)). \(K_{c\,ini}\) is strongly affected by how often the soil surface is wetted — frequent sprinkler or rain wetting raises it, drip under mulch lowers it. The two upper \(K_c\) values are tabulated for a sub-humid reference climate (\(RH_{min} \approx 45\,\%\), wind \(u_2 \approx 2\) m/s) and must be adjusted for drier or windier conditions using FAO-56 Eq. 62:
$$K_{c\,mid} = K_{c\,mid(Tab)} + \left[0.04\,(u_2 - 2) - 0.004\,(RH_{min} - 45)\right]\left(\frac{h}{3}\right)^{0.3}$$
where \(u_2\) is mean wind speed at 2 m (m/s, valid 1–6), \(RH_{min}\) is mean daily minimum relative humidity in % (valid 20–80) and \(h\) is mean plant height in m. The same correction applies to \(K_{c\,end}\) when it exceeds 0.45. In an arid, windy climate this can raise \(K_{c\,mid}\) of a tall crop such as maize by 0.05–0.10; in a humid climate it reduces it.
Typical ET₀, Rainfall Effectiveness and System Efficiency Ranges
Use these ranges as sanity checks when you do not yet have local measurements. They are broad, climate-based figures — always prefer a nearby weather station, a published regional ET₀ map or an on-farm sensor when one exists.
Reference evapotranspiration ET₀ (grass reference, FAO-56 Penman–Monteith)
| Climate / season | Typical ET₀ (mm/day) | Notes |
|---|---|---|
| Cool humid, or any temperate winter | 1–3 | Short days, low radiation, high humidity |
| Temperate spring / autumn, humid summer | 3–5 | Most of NW Europe, humid subtropics outside peak summer |
| Semi-arid summer, Mediterranean summer | 5–8 | Peak demand for most field crops |
| Arid / desert summer, hot windy inland areas | 8–12 | Advection and low humidity dominate; can exceed 12 on extreme days |
Application efficiency Ea by irrigation method
Application efficiency is the fraction of applied water stored in the root zone and available to the crop. The ranges below follow FAO irrigation guidance and ASABE/US irrigation-engineering practice (ASABE is a US standards body; the ranges themselves are widely used internationally). Enter the percentage directly in the Efficiency field.
| System | Ea (%) | Main losses |
|---|---|---|
| Surface — furrow | 50–65 | Deep percolation at head of run, tail-water runoff |
| Surface — border / basin | 60–75 | Deep percolation, uneven levelling |
| Sprinkler — solid set, centre pivot, travelling gun | 70–85 | Wind drift, evaporation, overlap non-uniformity |
| Micro-sprinkler / LEPA-type low-pressure | 80–90 | Limited drift, some soil-surface evaporation |
| Drip / trickle (surface or subsurface) | 85–95 | Emitter clogging, pressure variation, localised percolation |
Take the lower end of each band for old, poorly maintained or badly levelled systems, hot windy conditions and coarse sandy soils; take the upper end only where uniformity has actually been measured.
Effective rainfall Pe
Only part of gross rainfall reaches the root zone — the rest runs off, is intercepted by the canopy, or percolates below the roots. As a planning rule of thumb based on the USDA Soil Conservation Service method (a US procedure, widely reused elsewhere), effective rainfall is about 60–80 % of gross rainfall on medium-textured soils with moderate slopes and reasonable cover. Reduce this towards 40–50 % on steep, crusted or compacted ground, on shallow soils with little storage, and for intense short storms; small rainfall events under about 5 mm on a dry hot surface may be effectively 0. Enter the effective daily depth in the Rain field, not the raw gauge reading.
Irrigation interval and application depth by soil texture
The depth you can usefully apply at one time is limited by soil storage: \(d_{net} = p \cdot TAW \cdot Z_r\), where \(TAW\) is total available water per metre of soil, \(Z_r\) the rooting depth (m) and \(p\) the allowable depletion fraction (commonly 0.4–0.6 for field crops, lower for shallow-rooted vegetables).
| Soil texture | Approx. TAW (mm per m of root depth) | Typical net depth per irrigation (mm) | Typical interval at peak demand (days) |
|---|---|---|---|
| Sand / sandy | 60–100 | 15–25 | 2–4 |
| Sandy loam / loamy sand | 90–150 | 20–30 | 3–6 |
| Loam / silt loam | 140–230 | 25–45 | 5–10 |
| Clay loam / clay | 150–230 | 40–60 | 8–14 |
Intervals shorten roughly in proportion to ETc: a crop using 7 mm/day on a loam holding a 35 mm refill needs water about every 5 days, while the same soil and crop at 2 mm/day stretches to more than two weeks. Drip systems deliberately ignore the interval column and irrigate daily or several times a day at small depths, which is why they tolerate sandy soils so well.
How the Result Changes Across Scenarios
Every row below holds the field area at 1 ha and the period at 7 days, and varies only climate demand (ET₀), growth stage (Kc), effective rainfall and system efficiency. The chain of calculation is:
$$ET_c = K_c \cdot ET_0 \quad\rightarrow\quad d_{net} = (ET_c - P_e)\cdot D \quad\rightarrow\quad d_{gross} = \frac{d_{net}}{E_a/100} \quad\rightarrow\quad V = d_{gross}\times \frac{A}{1000}$$
| Scenario | ET₀ (mm/d) | Kc | Pe (mm/d) | Ea (%) | ETc (mm/d) | Net depth, 7 d (mm) | Gross depth, 7 d (mm) | Volume (m³) |
|---|---|---|---|---|---|---|---|---|
| Cool spring, seedling stage, furrow | 3 | 0.40 | 0 | 55 | 1.20 | 8.4 | 15.3 | 152.7 |
| Cool spring, full cover, sprinkler | 3 | 1.15 | 0 | 75 | 3.45 | 24.2 | 32.2 | 322.0 |
| Semi-arid summer, full cover, furrow | 6 | 1.15 | 0 | 55 | 6.90 | 48.3 | 87.8 | 878.2 |
| Semi-arid summer, full cover, sprinkler | 6 | 1.15 | 0 | 75 | 6.90 | 48.3 | 64.4 | 644.0 |
| Semi-arid summer, full cover, drip | 6 | 1.15 | 0 | 90 | 6.90 | 48.3 | 53.7 | 536.7 |
| Semi-arid summer with 2 mm/d useful rain, sprinkler | 6 | 1.15 | 2 | 75 | 6.90 | 34.3 | 45.7 | 457.3 |
| Desert peak, full cover, furrow | 9 | 1.15 | 0 | 55 | 10.35 | 72.5 | 131.7 | 1317.3 |
| Desert peak, full cover, drip | 9 | 1.15 | 0 | 90 | 10.35 | 72.5 | 80.5 | 805.0 |
| Desert peak, seedling stage, 2 mm/d useful rain, drip | 9 | 0.40 | 2 | 90 | 3.60 | 11.2 | 12.4 | 124.4 |
Worked check on the fourth row: \(ET_c = 1.15 \times 6 = 6.90\) mm/day, net demand \((6.90 - 0)\times 7 = 48.3\) mm, gross \(48.3 / 0.75 = 64.4\) mm, volume \(64.4 \times 10000/1000 = 644\) m³ — because 1 mm on 1 ha is exactly 10 m³.
Takeaway: at the same net crop demand (48.3 mm over the week), switching from a 55 %-efficient furrow system to a 90 %-efficient drip system cuts the pumped volume from 878 m³ to 537 m³ per hectare — roughly a 40 % reduction in water and pumping energy, with no change in what the crop actually receives.
Two further points the table makes clear: effective rainfall subtracts before the efficiency division, so each 1 mm/day of useful rain saves more than 10 m³/ha/day on an inefficient system; and if \(P_e\) equals or exceeds \(ET_c\) the net requirement is zero — treat any negative result as "no irrigation needed this period", not as a credit to carry forward.
Key Terms and Variables
- Reference evapotranspiration, ET₀ (mm/day)
- Evapotranspiration from a hypothetical, well-watered grass reference surface 0.12 m tall with a fixed surface resistance of 70 s/m and albedo 0.23, computed with the FAO-56 Penman–Monteith equation. It expresses climate demand only — radiation, temperature, humidity and wind — and is independent of the crop actually grown.
- Crop evapotranspiration, ETc (mm/day)
- Water consumed by the specific crop under standard (disease-free, well-fertilised, unstressed) conditions: \(ET_c = K_c \cdot ET_0\). It is the sum of transpiration from the canopy and evaporation from the soil surface.
- Crop coefficient, Kc (dimensionless)
- The ratio \(ET_c / ET_0\). It changes through the season from \(K_{c\,ini}\) at emergence, through \(K_{c\,mid}\) at full cover, to \(K_{c\,end}\) at harvest. Typical range 0.3–1.2 for annual crops; select a value in the Crop field or enter your own with the custom Kc input.
- Effective rainfall, Pe (mm/day)
- The share of gross rainfall actually stored in the root zone and usable by the crop, after runoff, canopy interception and deep percolation. Always smaller than gauge rainfall. This is the value to enter in the Rain field.
- Application efficiency, Ea (%)
- Water stored in the root zone divided by water delivered to the field, expressed as a percentage. It accounts for drift, evaporation, runoff, percolation below the roots and distribution non-uniformity. Distinct from conveyance efficiency (losses in canals and pipes upstream of the field), which must be applied as a further division if your water source is measured at the headworks.
- Net irrigation requirement, In (mm)
- The depth the crop needs from irrigation: \(I_n = (ET_c - P_e)\,D\) over \(D\) days, ignoring system losses. This is what the plant experiences.
- Gross irrigation requirement, Ig (mm)
- The depth that must be delivered to the field so the net requirement is met: \(I_g = I_n/(E_a/100)\). This is what you pump and pay for; it is always larger than \(I_n\).
- Irrigation depth (mm) vs. volume (m³)
- Depth is area-independent and lets you compare fields and crops directly; volume is what a meter, pump or water allocation is expressed in. The calculator reports both: \(V = I_g \times A / 1000\) with \(A\) in m².
- Leaching requirement, LR (dimensionless fraction)
- Extra water applied beyond ETc to flush salts out of the root zone where irrigation water is saline. For surface irrigation it is commonly estimated as \(LR = \dfrac{EC_w}{5\,EC_e - EC_w}\), with \(EC_w\) the electrical conductivity of the irrigation water and \(EC_e\) the soil salinity the crop tolerates (dS/m), after FAO Irrigation and Drainage Paper 29. The leaching-adjusted gross depth is \(I_g/(1 - LR)\). This calculator does not add a leaching fraction — add it yourself in saline or arid closed-basin conditions.
- The 1 mm over 1 ha = 10 m³ equivalence
- A depth of 1 mm is 0.001 m, and 1 ha is 10 000 m², so \(0.001 \times 10\,000 = 10\) m³ — equivalently 10 000 litres per hectare, or 1 litre per m². Useful conversions follow directly: 1 mm on 1 acre ≈ 4.047 m³, and 1 mm/day on 10 ha is 100 m³/day ≈ 1.16 L/s of continuous flow.
- Total available water, TAW, and depletion fraction, p
- TAW is the water held between field capacity and permanent wilting point in the root zone (mm); \(p\) is the fraction of TAW that may be depleted before the crop is stressed. Together they set the maximum sensible application depth and therefore the irrigation interval, rather than the seasonal total.
Unit reminder: 1 mm/day = 10 m³/ha/day = 0.1157 L/s/ha of continuous equivalent flow, and 1 mm = 1 kg of water per m² of land.
FAQ
Where do I get ET0? From a nearby agro-meteorological station, a national weather service, or an app that reports reference ET. Typical values range from about 2 mm/day in cool cloudy weather to 8-10 mm/day in hot dry conditions.
Why divide by efficiency? Some applied water never reaches the root zone through evaporation, wind drift, deep percolation and canal losses. Dividing by \(E_a\) tells you how much to deliver so the crop still receives the net depth.
Is effective rainfall the same as rainfall? No. Only part of a storm infiltrates and stays in the root zone; the rest runs off or drains. A common field rule is 60-80% of measured rainfall during moderate events.