What this calculator does
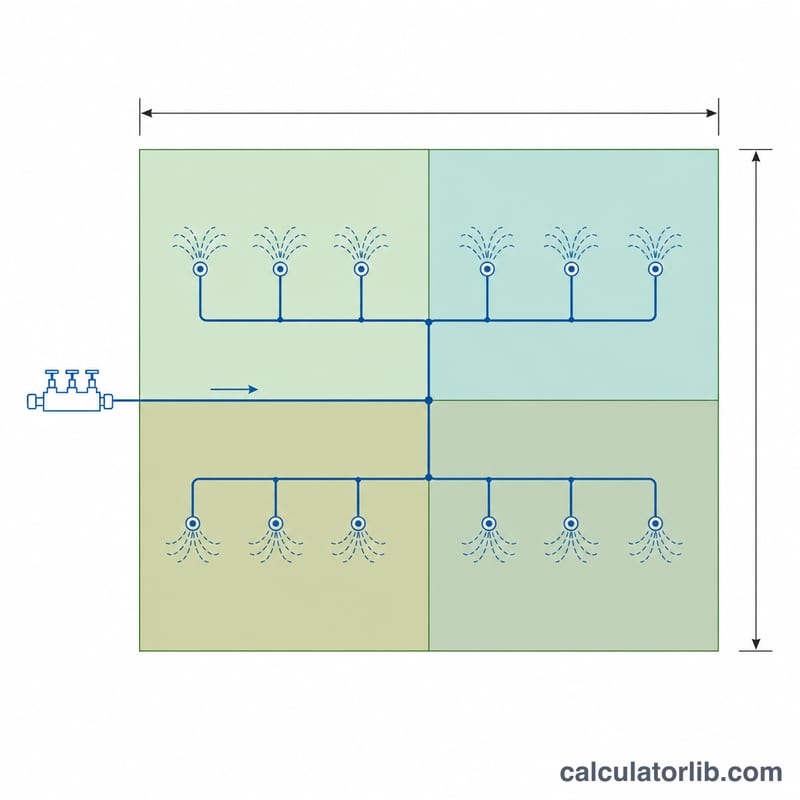
An irrigation controller hides the real number: you set minutes, not liters. This calculator converts your schedule into actual water use. Enter the flow rate of one zone, how many zones run, how long each one runs, how many days a week you water and how long the period is, and it returns the total volume in liters and US gallons, the weekly and daily averages, and the depth of water applied across the irrigated area.
The formula
Volume is simply flow multiplied by time, repeated over the schedule:
$$V = Q \times t \times n_z \times d \times w$$where \(Q\) = flow rate of one zone (L/min), \(t\) = run time per zone in minutes, \(n_z\) = number of zones, \(d\) = watering days per week and \(w\) = number of weeks. Gallon-per-minute input is converted with \(1\ \text{gal} = 3.785412\ \text{L}\). The applied depth follows from the handy identity that one liter spread over one square meter is exactly one millimeter:
$$D_{mm} = \frac{V_{L}}{A_{m^2}}$$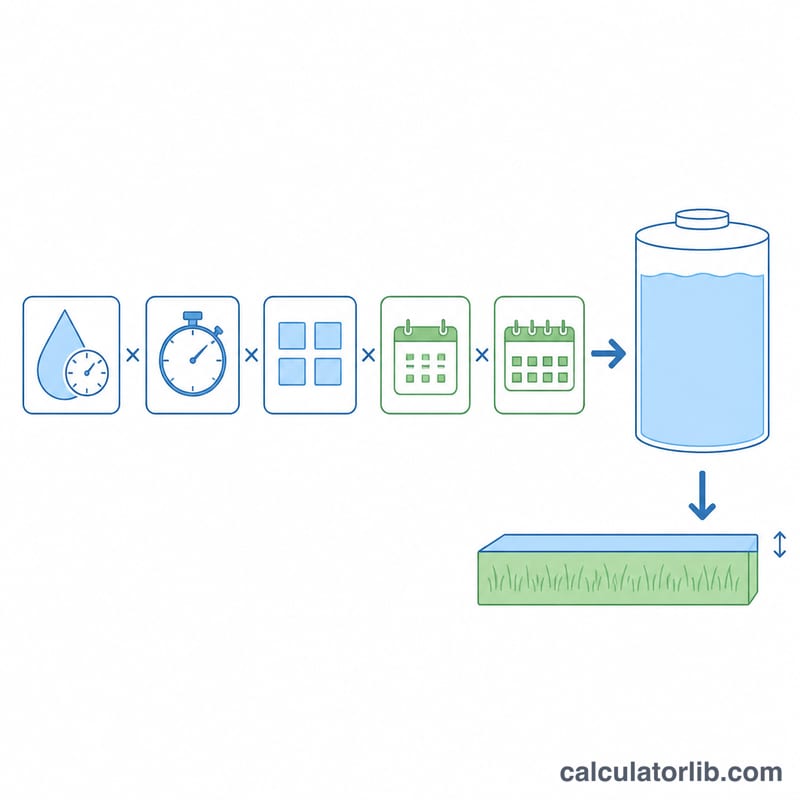
Applied depth assumes the whole volume lands on the irrigated area (1 liter spread over 1 m2 equals 1 mm). Real systems lose water to wind drift, runoff and evaporation, so divide the depth by your distribution efficiency (typically 0.65 to 0.90) to estimate what the plants actually receive.
Worked example
A garden has 4 zones, each flowing 20 L/min, running 15 minutes, three days a week for 4 weeks over 500 m2:
$$V = 20 \times 15 \times 4 \times 3 \times 4 = 14{,}400\ \text{L}$$That is about 3,804 US gallons, 3,600 L per week, and an applied depth of
$$D = \frac{14400}{500} = 28.8\ \text{mm} = 1.13\ \text{in}$$Roughly 7.2 mm per week — light for a hot summer lawn, which often wants 25 to 40 mm per week, so the run times could be increased.
Typical Weekly Water Requirements by Plant and Climate
Once the calculator gives you an applied depth in millimetres per week, compare it against the water the plants actually need. The values below are typical net requirements — the depth that must reach the root zone — expressed as replacement of crop evapotranspiration (reference \(ET_0\) from FAO-56 multiplied by a crop coefficient \(K_c\)):
$$ET_c = ET_0 \times K_c$$
| Plant type | Cool or mild summer climate | Hot or arid climate | Approx. mm/day | Typical frequency |
|---|---|---|---|---|
| Cool-season turf (tall fescue, Kentucky bluegrass, ryegrass), summer | 25–30 mm/week | 35–40+ mm/week | 3.5–6 | 2–3 deep cycles/week |
| Warm-season turf (bermuda, zoysia, buffalo) | 15–20 mm/week | 25–30 mm/week | 2–4.5 | 1–2 cycles/week |
| Established shrubs and ornamentals | 10–15 mm/week | 15–20 mm/week | 1.5–3 | 1–2 cycles/week |
| Vegetable garden (in production) | 25–30 mm/week | 30–35 mm/week | 3.5–5 | 2–4 cycles/week |
| Newly seeded or sodded lawn | 3–4 mm/day | 4–6 mm/day | 3–6 | Several short doses per day to keep the surface damp |
| Established trees | 20–30 mm every 1–2 weeks | 30–40 mm every 1–2 weeks | — | Infrequent, deep, out to the drip line |
How to use these numbers correctly:
- They are net, not gross. The calculator's depth \(D = V_{\text{total}}/A\) is what leaves the nozzles. Multiply it by the application efficiency from the previous section before comparing — e.g. a spray zone applying 35 mm/week at \(E_a = 0.72\) delivers only about 25 mm net.
- Subtract effective rainfall. Only part of measured rainfall enters the root zone; light showers under about 5 mm often evaporate, and heavy downpours partly run off. A common planning rule is to credit roughly 70–80 % of moderate rainfall, then irrigate the shortfall: \(D_{\text{net required}} = ET_c - P_{\text{eff}}\).
- These are seasonal peaks. Spring and autumn demand is often half the mid-summer figure, and dormant warm-season turf needs far less. Adjust monthly rather than setting one schedule for the year.
- Soil sets the frequency, plants set the volume. Sandy soils hold roughly 60–100 mm of available water per metre of depth and need smaller, more frequent doses; clay loams hold far more and prefer fewer, deeper cycles. If water runs off before the cycle ends, split the run time into two or three shorter cycles separated by 30–60 minutes.
These are general planning ranges, not a prescription for a specific garden. Local climate, soil, shade, plant age and — importantly — any local watering restrictions or day-of-week rules in your area take precedence. Where a water utility or agricultural extension service publishes ET-based schedules for your region, use those figures in place of the table above.
FAQ
How do I find my flow rate? Read the nozzle chart for your sprinkler heads and add the heads on one zone, or run a single zone and time how long it takes to fill a known-volume bucket at a hose bib on the same line.
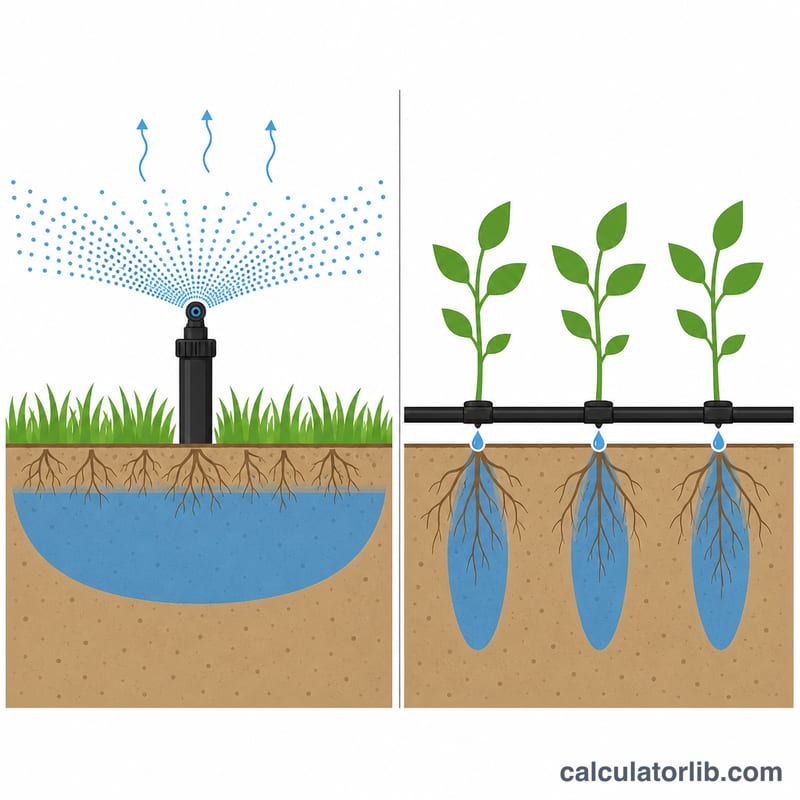
Should I use the gross or net depth? This tool reports gross applied depth. Divide by your system efficiency — about 0.75 for spray heads, 0.80 to 0.90 for rotors and drip — to estimate the net depth reaching the root zone.
Can I model drip irrigation? Yes. Multiply the number of emitters on a zone by the emitter rate in liters per hour, divide by 60 to get L/min, and enter that as the zone flow rate.