
What is the Salary Percentile Calculator?
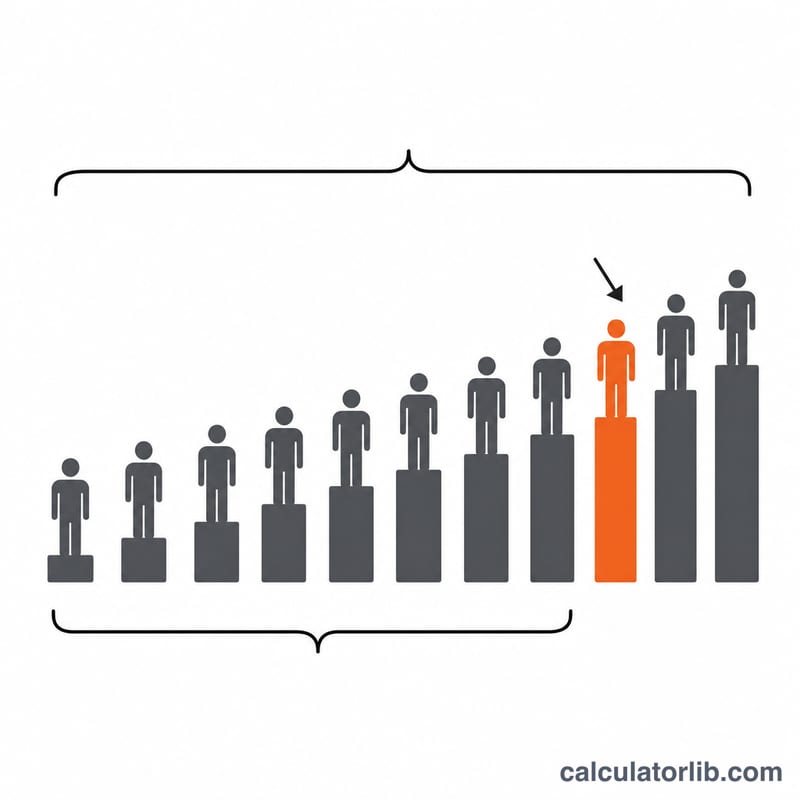
This tool tells you where your pay ranks within a group of earners. A salary percentile is the percentage of people who earn less than you. If you sit in the 75th percentile, you earn more than 75% of the people in your comparison group — whether that group is your company, your industry, or a national dataset.
How to use it
Enter two numbers: how many people in the group earn less than you, and the total number of people in the group. The calculator divides the first by the second and multiplies by 100 to give your percentile, plus the percentage of people who out-earn you.
The formula explained
The percentile rank is simply $$\text{Percentile} = \frac{\text{number below}}{\text{total count}} \times 100$$ The "number below" is the count of earners with a lower salary than yours. Dividing by the total group size gives the fraction below you; multiplying by 100 turns it into a familiar percentage. The complement, \(100 - \text{percentile}\), is the share who earn more.
Worked example
Suppose your dataset has 1,000 employees and 750 of them earn less than you. Your percentile is $$\frac{750}{1000} \times 100 = \textbf{75th percentile}$$ That means you earn more than 75% of the group, while 25% earn more than you.
Interpreting Your Salary Percentile
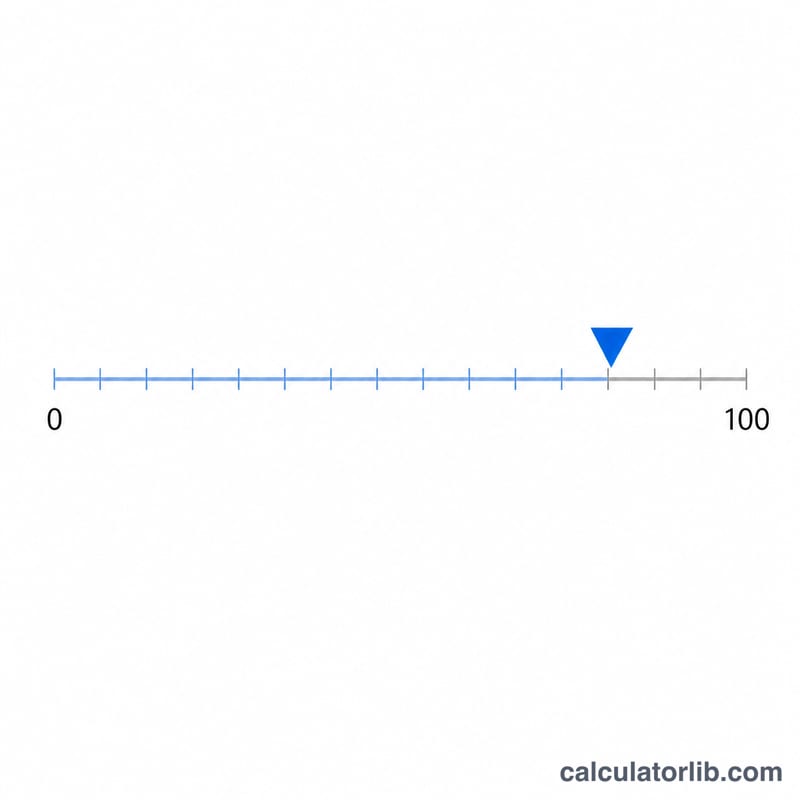
This calculator uses the formula \(\text{Percentile} = \frac{ {\text{People Earning Less}}}{ {\text{Total People}}} \times 100\). The result tells you what share of a group earns less than you. For example, if 75 of 100 people earn less than you, your percentile is 75, meaning you out-earn 75% of the group and 25% earn the same or more.
Common bands (descriptive only)
- Below the 25th percentile: your pay sits in the lower quarter of the group; at least three quarters of people earn more than you.
- 25th to 75th percentile: your pay is in the middle half of the group, often called the interquartile range. This is where most people in a group fall.
- Above the 75th percentile: your pay is in the top quarter; at least three quarters of the group earn less than you.
Percentile vs. percentile rank vs. percent of salary
A percentile rank is the percentage of a group that falls below a given value, which is what this tool computes for your salary. A percentile (for example, the 90th percentile) is often used to name the salary value at that rank. Neither is a percent of salary: being at the 80th percentile does not mean you earn 80% of the top pay or that your salary is 80% of anything. It only describes rank.
The comparison group matters
The same salary can produce very different percentiles depending on who you compare against: your company, your industry, your job title, your city or region, or the whole country. A salary may be high within a small local employer but average within a national group in the same field. Always note which group and which year your data comes from, and make sure pay is measured the same way (base pay vs. total compensation, full-time vs. part-time, same currency).
The median
The median is the 50th percentile: half the group earns less and half earns more. It is often more representative than the average because a few very high earners can pull the average upward.
Percentile describes rank only. This is general information, not financial or career advice.
Percentile Across Different Group Sizes
The percentile depends on the proportion below you, not the group size. Each row applies \(\frac{ {\text{number below}}}{ {\text{total}}} \times 100\). The percent who earn more is shown as 100 minus the percentile, which assumes nobody else earns exactly your salary (see the note on ties in the glossary).
| Number below | Total count | Calculation | Percentile | Percent who earn more |
|---|---|---|---|---|
| 50 | 100 | 50 ÷ 100 × 100 | 50th | 50% |
| 250 | 500 | 250 ÷ 500 × 100 | 50th | 50% |
| 90 | 100 | 90 ÷ 100 × 100 | 90th | 10% |
| 15 | 60 | 15 ÷ 60 × 100 | 25th | 75% |
| 999 | 1000 | 999 ÷ 1000 × 100 | 99.9th | 0.1% |
Rows 1 and 2 show that 50 of 100 and 250 of 500 give the same result because the ratio is identical. Larger groups simply give finer detail, as in the last row.
Key Terms: Percentile, Median and Quartile
- Percentile
- A value below which a given percentage of a dataset falls. The 90th percentile salary is the pay level that about 90% of the group earns less than.
- Percentile rank
- The percentage of the group that earns less than a specific salary. This calculator returns your percentile rank.
- Median (50th percentile)
- The middle value when salaries are sorted: half earn less and half earn more.
- Quartile
- Points that split the sorted data into four equal parts: Q1 is the 25th percentile, Q2 is the 50th percentile (the median), and Q3 is the 75th percentile.
- Decile
- Points that split the data into ten equal parts: the 1st decile is the 10th percentile, the 5th decile is the median, and so on.
- Comparison group (dataset)
- The set of people your salary is ranked against, such as a company, occupation, region or country. Your percentile is only meaningful relative to this group.
A note on ties
If other people earn exactly your salary, do not count them in “number below.” Count only those who earn strictly less. This is the convention used here, so the result is the share strictly below you. Some methods add half of the tied people to the count, which gives a slightly higher rank; if you use that approach, add half the ties to the number below before entering it. With many ties, “percent who earn more” will be lower than 100 minus your percentile, because the tied people earn neither less nor more.
Income and jobs: United States
Average income and unemployment in United States compared with the world, from the World Bank: a benchmark for the figures you enter above.
- GNI per capita 2025
- 88,810 USD
- GDP per capita, PPP 2025
- 90,027 intl. $
- World: 25,704
- Unemployment 2025
- 4.2%
- World: 4.8%
Latest change Up +7.1% 2025: 88,810 USD, against 82,910 USD in 2024. CalculatorLib computes this change from the two published figures.
In 2025, gross national income per person in United States was 88,810 US dollars a year, about 7,401 US dollars a month. World: 14,244 USD
| Year | GNI per capita (USD) | GDP per capita, PPP (intl. $) | Unemployment |
|---|---|---|---|
| 2025 | 88,810 | 90,027 | 4.2% |
| 2024 | 82,910 | 86,170 | 4.0% |
| 2023 | 79,950 | 82,587 | 3.6% |
| 2022 | 77,230 | 78,009 | 3.7% |
| 2021 | 71,510 | 71,441 | 5.3% |
| 2020 | 64,630 | 64,465 | 8.1% |
| 2019 | 65,840 | 65,228 | 3.7% |
| 2018 | 63,040 | 62,876 | 3.9% |
| 2017 | 58,860 | 60,048 | 4.4% |
| 2016 | 56,830 | 57,977 | 4.9% |
GNI per capita (Atlas method) is the average of all income in the economy, not a typical salary; PPP dollars adjust for local prices.
Income tax and social security: United States
- Top income tax rate 2025
- 43.65%
- from 8.7 × the average wage
- Employee social security 2025
- 7.65% · 1.45%
In 2025, the top statutory personal income tax rate in United States (central and local government combined) was 43.65%. It applies from 8.7 times the average wage of 73,520 USD, that is from about 642,101 USD a year.
Employee social security contribution rates for successive earnings bands, lowest band first; the band limits are not shown.
Top income tax rates in OECD countries
| Country | Top rate | Applies from (× average wage) | Year |
|---|---|---|---|
| Japan | 55.95% | 7.7 | 2025 |
| France | 55.37% | 12.9 | 2025 |
| South Korea | 49.5% | 19.0 | 2025 |
| Germany | 47.48% | 4.4 | 2025 |
| United Kingdom | 45% | 2.2 | 2025 |
| United States | 43.65% | 8.7 | 2025 |
| Türkiye | 40.76% | 5.6 | 2025 |
| Mexico | 35% | 20.6 | 2025 |
The top rate is the statutory rate on the highest earnings, not the rate most workers pay. OECD figures cover OECD member countries only.
United States and other countries
GNI per capita in current US dollars (Atlas method) — each country’s latest published year.
- United States 88,810 USD (2025)
- France 48,630 USD (2025)
- Japan 38,340 USD (2025)
- South Korea 37,880 USD (2025)
- Saudi Arabia 36,070 USD (2025)
- Türkiye 16,300 USD (2025)
- Russia 15,960 USD (2025)
- World 14,244 USD (2025)
- China 14,230 USD (2025)
- Mexico 13,730 USD (2025)
- Vietnam 4,970 USD (2025)
- India 2,760 USD (2025)
No published figure yet for Taiwan.
Years can differ between rows: each figure is shown with its own year. The same World Bank indicator for every country.
Latest figure: 2025 Data last updated 2026-10-18 · current
Source: The World Bank Group CC BY 4.0; OECD, Tax Database CC BY 4.0
Monthly figures are computed by CalculatorLib from these data. The top-rate threshold in national currency (multiple × average wage) is computed by CalculatorLib from these data.
Source details and methodology
- The World Bank Group — World Development Indicators (NY.GNP.PCAP.CD, NY.GDP.PCAP.PP.CD, SL.UEM.TOTL.ZS)
- OECD, Tax Database — Top statutory personal income tax rate; employee social security contribution rates
FAQ
Is the percentile the same as a percentage raise? No. The percentile describes your rank in the group, not a change in your pay.
What if I don't know how many earn less? Use survey or HR data, or any ranked salary list and count the positions below yours.
Can the percentile be 100? Yes, if everyone else in the group earns less than you — but most datasets show no one at exactly 100 because the top earner still ranks among the group.