
What Is the Salary Breakdown Calculator?
This calculator takes your gross annual salary and converts it into equivalent hourly, daily, weekly, and monthly pay. It's useful for comparing job offers, setting freelance rates, budgeting, or simply understanding what your salary really works out to per hour. The tool uses your stated weekly hours and yearly work days, so the result reflects your actual schedule rather than a generic assumption.
How to Use It
Enter three values: your annual salary (gross, before tax), the number of hours you work per week, and the number of work days per year. A standard full-time schedule is 40 hours per week and roughly 260 work days a year (52 weeks \(\times\) 5 days). Adjust these to match part-time, compressed, or shift-based schedules. The calculator instantly returns each pay period.
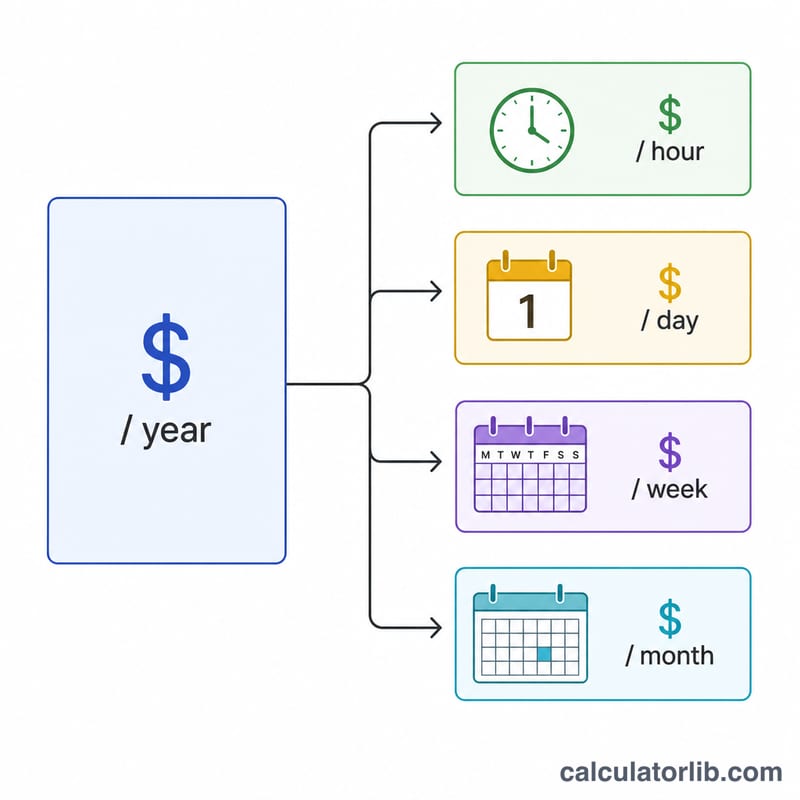
The Formula Explained
The math is straightforward division:
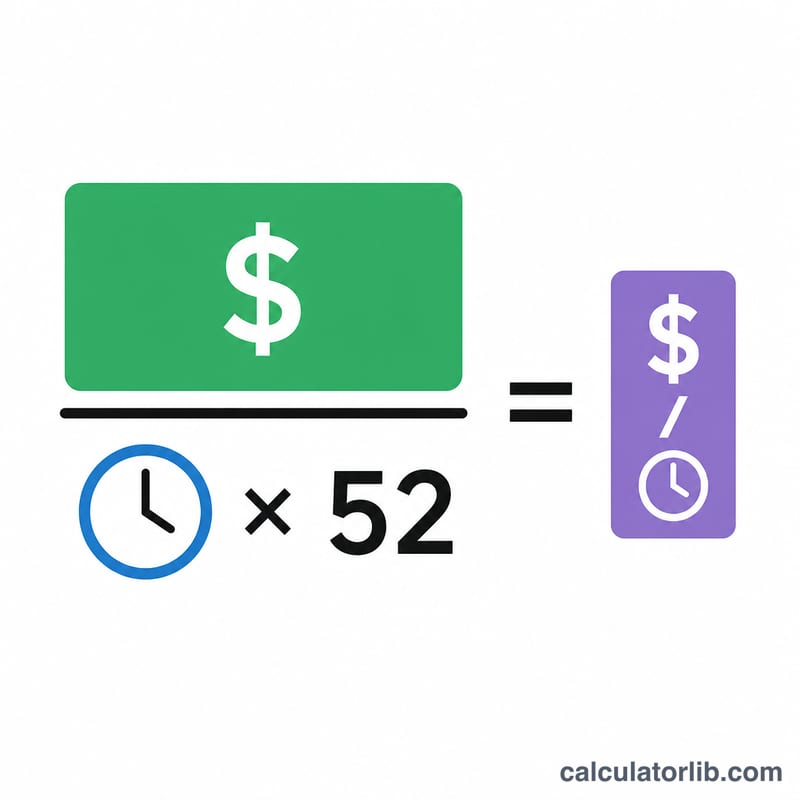
$$\text{Hourly} = \frac{\text{Annual Salary}}{\text{Hours/Week} \times 52}$$$$\text{Daily} = \frac{\text{Annual Salary}}{\text{Work Days/Year}} \quad\;\; \text{Weekly} = \frac{\text{Annual Salary}}{52} \quad\;\; \text{Monthly} = \frac{\text{Annual Salary}}{12}$$Hourly = Annual \(\div\) (Hours per week \(\times\) 52). There are 52 weeks in a year, so multiplying weekly hours by 52 gives total annual hours.
Daily = Annual \(\div\) Work days per year.
Weekly = Annual \(\div\) 52.
Monthly = Annual \(\div\) 12.
Worked Example
Suppose you earn $52,000 a year, work 40 hours per week over 260 work days. $$\text{Hourly} = 52{,}000 \div (40 \times 52) = 52{,}000 \div 2{,}080 = \$25.00$$ $$\text{Daily} = 52{,}000 \div 260 = \$200.00$$ $$\text{Weekly} = 52{,}000 \div 52 = \$1{,}000.00$$ $$\text{Monthly} = 52{,}000 \div 12 \approx \$4{,}333.33$$
Income and jobs: United States
Average income and unemployment in United States compared with the world, from the World Bank: a benchmark for the figures you enter above.
- GNI per capita 2025
- 88,810 USD
- GDP per capita, PPP 2025
- 90,027 intl. $
- World: 25,704
- Unemployment 2025
- 4.2%
- World: 4.8%
Latest change Up +7.1% 2025: 88,810 USD, against 82,910 USD in 2024. CalculatorLib computes this change from the two published figures.
In 2025, gross national income per person in United States was 88,810 US dollars a year, about 7,401 US dollars a month. World: 14,244 USD
| Year | GNI per capita (USD) | GDP per capita, PPP (intl. $) | Unemployment |
|---|---|---|---|
| 2025 | 88,810 | 90,027 | 4.2% |
| 2024 | 82,910 | 86,170 | 4.0% |
| 2023 | 79,950 | 82,587 | 3.6% |
| 2022 | 77,230 | 78,009 | 3.7% |
| 2021 | 71,510 | 71,441 | 5.3% |
| 2020 | 64,630 | 64,465 | 8.1% |
| 2019 | 65,840 | 65,228 | 3.7% |
| 2018 | 63,040 | 62,876 | 3.9% |
| 2017 | 58,860 | 60,048 | 4.4% |
| 2016 | 56,830 | 57,977 | 4.9% |
GNI per capita (Atlas method) is the average of all income in the economy, not a typical salary; PPP dollars adjust for local prices.
Income tax and social security: United States
- Top income tax rate 2025
- 43.65%
- from 8.7 × the average wage
- Employee social security 2025
- 7.65% · 1.45%
In 2025, the top statutory personal income tax rate in United States (central and local government combined) was 43.65%. It applies from 8.7 times the average wage of 73,520 USD, that is from about 642,101 USD a year.
Employee social security contribution rates for successive earnings bands, lowest band first; the band limits are not shown.
Top income tax rates in OECD countries
| Country | Top rate | Applies from (× average wage) | Year |
|---|---|---|---|
| Japan | 55.95% | 7.7 | 2025 |
| France | 55.37% | 12.9 | 2025 |
| South Korea | 49.5% | 19.0 | 2025 |
| Germany | 47.48% | 4.4 | 2025 |
| United Kingdom | 45% | 2.2 | 2025 |
| United States | 43.65% | 8.7 | 2025 |
| Türkiye | 40.76% | 5.6 | 2025 |
| Mexico | 35% | 20.6 | 2025 |
The top rate is the statutory rate on the highest earnings, not the rate most workers pay. OECD figures cover OECD member countries only.
United States and other countries
GNI per capita in current US dollars (Atlas method) — each country’s latest published year.
- United States 88,810 USD (2025)
- France 48,630 USD (2025)
- Japan 38,340 USD (2025)
- South Korea 37,880 USD (2025)
- Saudi Arabia 36,070 USD (2025)
- Türkiye 16,300 USD (2025)
- Russia 15,960 USD (2025)
- World 14,244 USD (2025)
- China 14,230 USD (2025)
- Mexico 13,730 USD (2025)
- Vietnam 4,970 USD (2025)
- India 2,760 USD (2025)
No published figure yet for Taiwan.
Years can differ between rows: each figure is shown with its own year. The same World Bank indicator for every country.
Latest figure: 2025 Data last updated 2026-10-18 · current
Source: The World Bank Group CC BY 4.0; OECD, Tax Database CC BY 4.0
Monthly figures are computed by CalculatorLib from these data. The top-rate threshold in national currency (multiple × average wage) is computed by CalculatorLib from these data.
Source details and methodology
- The World Bank Group — World Development Indicators (NY.GNP.PCAP.CD, NY.GDP.PCAP.PP.CD, SL.UEM.TOTL.ZS)
- OECD, Tax Database — Top statutory personal income tax rate; employee social security contribution rates
FAQ
Is this before or after tax? The breakdown uses your gross (pre-tax) annual salary. It does not deduct income tax or other withholdings.
How many work days should I use? Full-time workers typically use about 260 days (5 days \(\times\) 52 weeks), though this drops if you subtract public holidays and paid leave.
Why is monthly not simply weekly \(\times\) 4? A year has about 4.33 weeks per month, so dividing the annual salary by 12 gives a more accurate monthly figure than multiplying weekly pay by 4.