
What Is the Monthly to Annual Salary Calculator?
This calculator converts a monthly salary into an equivalent annual (yearly) salary. It is useful when comparing job offers, completing loan or rental applications, budgeting, or any situation where pay is quoted monthly but you need the full-year figure. The conversion works for any currency since it is a pure multiplication.
How to Use It
Enter your gross monthly salary (the amount before tax and deductions, unless you want a net figure). Click calculate and the tool instantly shows your annual salary. Because there are 12 months in a year, the math is straightforward and applies universally.
The Formula Explained
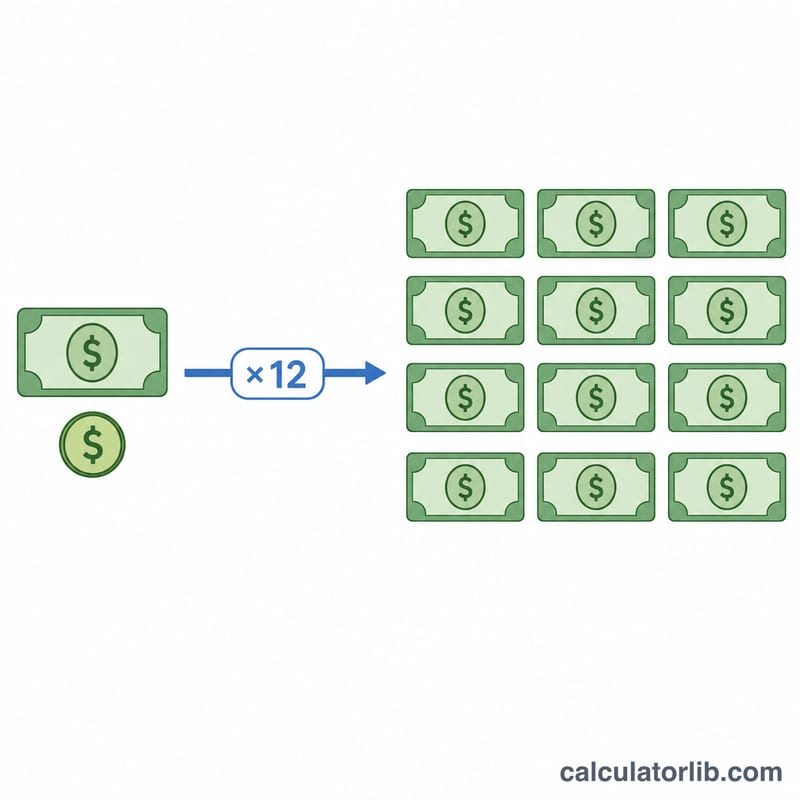
The formula is $$\text{Annual Salary} = \text{Monthly Salary} \times 12$$. A year always contains 12 months, so multiplying your monthly pay by 12 gives the total earned over a full year. This assumes a consistent monthly amount with no bonuses or one-off payments. If you receive a 13th-month bonus or other extras, add those separately.
Worked Example
Suppose you earn 5,000 per month. Your annual salary is $$5{,}000 \times 12 = 60{,}000$$ per year. If you earn 3,250 per month, your annual salary would be $$3{,}250 \times 12 = 39{,}000$$.
Pay Period Conversion Table
Annualizing pay means multiplying the amount earned in one pay period by the number of such periods in a year. The table below lists the standard multipliers, the reverse operation (annual back to that period), and the equivalent figure for a 60,000 annual salary. Currency is irrelevant to the arithmetic — the same multipliers apply in any currency.
| Pay period | Periods per year | Period → annual | Annual → period | Equivalent at 60,000/year |
|---|---|---|---|---|
| Monthly | 12 | × 12 | ÷ 12 | 5,000.00 |
| Semi-monthly (twice a month) | 24 | × 24 | ÷ 24 | 2,500.00 |
| Biweekly (every two weeks) | 26 | × 26 | ÷ 26 | 2,307.69 |
| Weekly | 52 | × 52 | ÷ 52 | 1,153.85 |
| Daily (working days) | 260 | × 260 | ÷ 260 | 230.77 |
| Hourly (40 h/week) | 2,080 | × 2,080 | ÷ 2,080 | 28.85 |
This calculator performs the first row only:
$$\text{Annual Salary} = \text{Monthly Salary} \times 12$$Worked example — a monthly salary of 5,000:
$$\text{Annual Salary} = 5{,}000 \times 12 = 60{,}000$$So 5,000 per month annualizes to 60,000 per year.
Two notes on the table. First, semi-monthly and biweekly are not the same thing: semi-monthly pays 24 times a year (typically mid-month and month-end), while biweekly pays every 14 days, giving 26 pay dates in most years and 27 in some years because 26 × 14 = 364 days, one day short of a calendar year. Second, the 260-working-day and 2,080-hour figures are conventions, not measurements: they assume a standard 5-day week of 40 hours (52 × 5 = 260 days, 260 × 8 = 2,080 hours) before subtracting public holidays, annual leave or sick days, and before any overtime. Countries and contracts with a 35-, 37.5- or 48-hour standard week, or with a 6-day week, produce different annual-hours figures — substitute your own contractual weekly hours × 52 if yours differs.
Interpreting Your Annual Salary Figure
The number this calculator returns is annualized base pay: your contractual monthly amount projected over twelve identical months. It answers one narrow question — "if I am paid this every month for a full year, what is the yearly total?" — and nothing more.
What it therefore excludes, unless those amounts are already inside the monthly figure you typed:
- Annual, quarterly or performance bonuses
- 13th-month pay, holiday allowance or similar statutory or customary extra payments used in many countries (for example the Philippines' mandatory 13th-month pay, Brazil's décimo terceiro, or the Dutch holiday allowance), where a 12× projection understates the yearly total
- Overtime, shift premiums, on-call and commission
- Employer pension or social-security contributions, health insurance and other benefits, which are a real cost to the employer but are not part of your base pay
- Stock, allowances, reimbursements and one-off payments
Because of those omissions the result is generally not your total compensation, and it may not match the gross figure on a year-end tax statement either — that statement reports what was actually paid and reported in the tax year, including extras and any mid-year changes.
Gross in, gross out. The multiplication is neutral about what the input represents. If you enter gross monthly pay, the result is gross annual pay; if you enter take-home (net) pay, the result is annual take-home. Mixing the two — for instance comparing your net-based result with a job advert quoting gross — compares unlike figures.
Tax is usually an annual calculation. In most income-tax systems, liability is assessed on total income for the tax year, with progressive brackets, allowances and thresholds applied to that annual total; monthly withholding is an approximation that is reconciled at year end. Multiplying one month's deduction by 12 therefore estimates your yearly tax rather than determining it, and the estimate drifts whenever pay changes mid-year, a bonus pushes income into a higher bracket, or allowances are not spread evenly across the year. Rules differ substantially by country.
Partial years are pro-rated. If you start, leave, take unpaid leave or change salary partway through the year, your actual earnings are the sum of what was really paid, not this annualized projection. For \(n\) full months at the same monthly rate the actual figure is
$$\text{Earnings} = \text{Monthly Salary} \times n, \qquad n < 12$$For example, seven months at 5,000 gives \(5{,}000 \times 7 = 35{,}000\), not 60,000 — even though the annualized rate of the job is 60,000. Job adverts, loan applications and benefit rules may ask for either the annualized rate or the actual amount earned, so it is worth checking which one is wanted.
Income and jobs: United States
Average income and unemployment in United States compared with the world, from the World Bank: a benchmark for the figures you enter above.
- GNI per capita 2025
- 88,810 USD
- GDP per capita, PPP 2025
- 90,027 intl. $
- World: 25,704
- Unemployment 2025
- 4.2%
- World: 4.8%
Latest change Up +7.1% 2025: 88,810 USD, against 82,910 USD in 2024. CalculatorLib computes this change from the two published figures.
In 2025, gross national income per person in United States was 88,810 US dollars a year, about 7,401 US dollars a month. World: 14,244 USD
| Year | GNI per capita (USD) | GDP per capita, PPP (intl. $) | Unemployment |
|---|---|---|---|
| 2025 | 88,810 | 90,027 | 4.2% |
| 2024 | 82,910 | 86,170 | 4.0% |
| 2023 | 79,950 | 82,587 | 3.6% |
| 2022 | 77,230 | 78,009 | 3.7% |
| 2021 | 71,510 | 71,441 | 5.3% |
| 2020 | 64,630 | 64,465 | 8.1% |
| 2019 | 65,840 | 65,228 | 3.7% |
| 2018 | 63,040 | 62,876 | 3.9% |
| 2017 | 58,860 | 60,048 | 4.4% |
| 2016 | 56,830 | 57,977 | 4.9% |
GNI per capita (Atlas method) is the average of all income in the economy, not a typical salary; PPP dollars adjust for local prices.
Income tax and social security: United States
- Top income tax rate 2025
- 43.65%
- from 8.7 × the average wage
- Employee social security 2025
- 7.65% · 1.45%
In 2025, the top statutory personal income tax rate in United States (central and local government combined) was 43.65%. It applies from 8.7 times the average wage of 73,520 USD, that is from about 642,101 USD a year.
Employee social security contribution rates for successive earnings bands, lowest band first; the band limits are not shown.
Top income tax rates in OECD countries
| Country | Top rate | Applies from (× average wage) | Year |
|---|---|---|---|
| Japan | 55.95% | 7.7 | 2025 |
| France | 55.37% | 12.9 | 2025 |
| South Korea | 49.5% | 19.0 | 2025 |
| Germany | 47.48% | 4.4 | 2025 |
| United Kingdom | 45% | 2.2 | 2025 |
| United States | 43.65% | 8.7 | 2025 |
| Türkiye | 40.76% | 5.6 | 2025 |
| Mexico | 35% | 20.6 | 2025 |
The top rate is the statutory rate on the highest earnings, not the rate most workers pay. OECD figures cover OECD member countries only.
United States and other countries
GNI per capita in current US dollars (Atlas method) — each country’s latest published year.
- United States 88,810 USD (2025)
- France 48,630 USD (2025)
- Japan 38,340 USD (2025)
- South Korea 37,880 USD (2025)
- Saudi Arabia 36,070 USD (2025)
- Türkiye 16,300 USD (2025)
- Russia 15,960 USD (2025)
- World 14,244 USD (2025)
- China 14,230 USD (2025)
- Mexico 13,730 USD (2025)
- Vietnam 4,970 USD (2025)
- India 2,760 USD (2025)
No published figure yet for Taiwan.
Years can differ between rows: each figure is shown with its own year. The same World Bank indicator for every country.
Latest figure: 2025 Data last updated 2026-10-18 · current
Source: The World Bank Group CC BY 4.0; OECD, Tax Database CC BY 4.0
Monthly figures are computed by CalculatorLib from these data. The top-rate threshold in national currency (multiple × average wage) is computed by CalculatorLib from these data.
Source details and methodology
- The World Bank Group — World Development Indicators (NY.GNP.PCAP.CD, NY.GDP.PCAP.PP.CD, SL.UEM.TOTL.ZS)
- OECD, Tax Database — Top statutory personal income tax rate; employee social security contribution rates
FAQ
Is this gross or net salary? The calculator simply multiplies whatever number you enter by 12. If you input gross monthly pay you get gross annual pay; net in, net out.
Does it account for bonuses? No. It assumes 12 equal monthly payments. Add bonuses or a 13th salary manually if applicable.
What about weekly or biweekly pay? This tool is for monthly pay only. For weekly pay, multiply by 52; for biweekly, multiply by 26.