
What Is the Pay Raise Over Time Calculator?
This calculator projects how your annual salary grows when you receive a consistent percentage raise each year. By compounding the raise year after year, it shows your expected future salary, the total dollar increase, the overall percentage gain, and the cumulative amount you would earn across the entire period. It is a universal financial tool useful for career planning and salary negotiations.

How to Use It
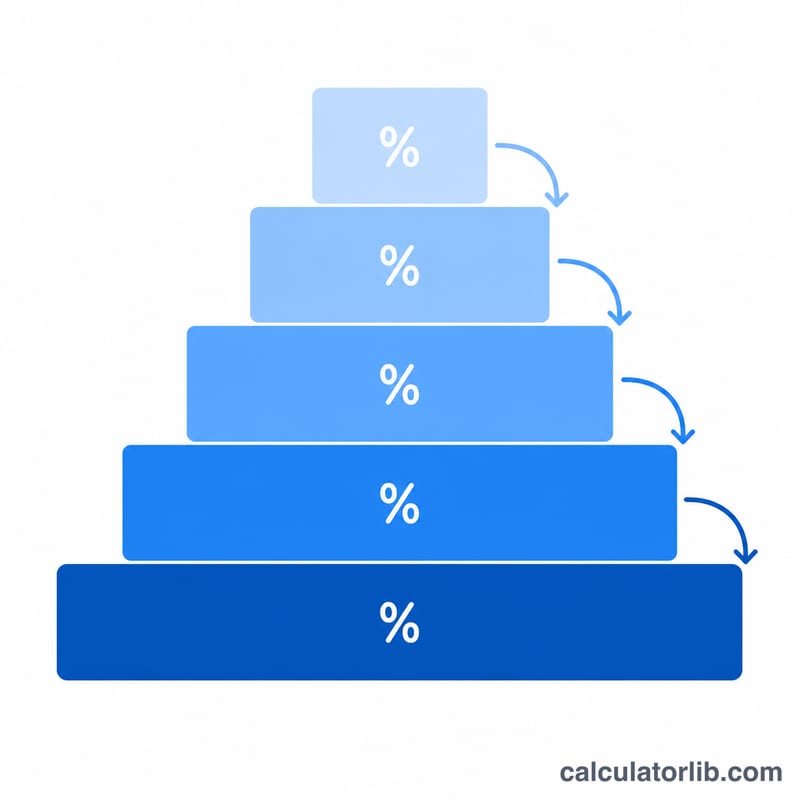
Enter your current annual salary, the expected annual raise rate as a percentage, and the number of years you want to project. The tool assumes the same raise rate applies each year and that raises compound — meaning each year increase is calculated on the previous year salary, not the original.
The Formula
The future salary is found with compound growth, where \(S_0\) = starting salary, \(r\) = raise rate as a decimal, and \(n\) = number of years:
$$S_n = S_0 \times (1 + r)^{n}$$The total increase is simply \(\Delta S = S_n - S_0\), and the percentage increase is \(\frac{\Delta S}{S_0} \times 100\).
Worked Example
Suppose you earn \(50000\) per year and expect a \(3\%\) raise annually for \(10\) years. Then:
$$S_{10} = 50000 \times (1.03)^{10} = 50000 \times 1.343916 = 67195.82$$Your total increase is \(67195.82 - 50000 = 17195.82\), a gain of about \(34.39\%\).
Salary Growth Across Different Raise Scenarios
The table below starts from the same salary — 60,000 per year in whatever currency you use — and applies a fixed annual raise that compounds each year. The final salary comes from
$$S_n = S_0 \times (1 + r)^n$$and cumulative earnings add up the salary paid in each year from year 1 through year \(n\), where year \(k\) is paid at the post-raise rate \(S_k = S_0(1+r)^k\):
$$E_n = \sum_{k=1}^{n} S_0 (1+r)^k = S_0 (1+r) \cdot \frac{(1+r)^n - 1}{r}$$| Annual raise \(r\) | Years \(n\) | Final salary \(S_n\) | Total increase | Percent gain | Cumulative earnings \(E_n\) |
|---|---|---|---|---|---|
| 2% | 5 | 66,244.85 | 6,244.85 | 10.41% | 318,487.26 |
| 2% | 10 | 73,139.67 | 13,139.67 | 21.90% | 670,122.93 |
| 2% | 20 | 89,156.84 | 29,156.84 | 48.59% | 1,486,999.03 |
| 3% | 5 | 69,556.44 | 9,556.44 | 15.93% | 328,104.59 |
| 3% | 10 | 80,634.98 | 20,634.98 | 34.39% | 708,467.74 |
| 3% | 20 | 108,366.67 | 48,366.67 | 80.61% | 1,660,589.14 |
| 5% | 5 | 76,576.89 | 16,576.89 | 27.63% | 348,114.77 |
| 5% | 10 | 97,733.68 | 37,733.68 | 62.89% | 792,407.23 |
| 5% | 20 | 159,197.86 | 99,197.86 | 165.33% | 2,083,155.11 |
| 7% | 5 | 84,153.10 | 24,153.10 | 40.26% | 369,197.44 |
| 7% | 10 | 118,029.08 | 58,029.08 | 96.72% | 887,015.96 |
| 7% | 20 | 232,181.07 | 172,181.07 | 286.97% | 2,631,910.61 |
Two patterns are worth noticing. First, the gap between raise rates widens dramatically with time: over 5 years, 7% beats 2% by about 18,000 in final salary, but over 20 years the gap is roughly 143,000 per year. Second, percent gain depends only on \(r\) and \(n\), not on the starting salary — a 3% raise for 10 years is a 34.39% gain whether you start at 30,000 or 300,000.
Assumptions and limits. All figures are gross (pre-tax) amounts in a single currency, with no inflation adjustment. They assume one raise per year at exactly the stated rate, applied to the full salary, with no promotions, job changes, bonuses, overtime, equity, employer benefits, or unpaid gaps. Income tax, payroll/social contributions and their brackets differ by country, so your take-home pay will be lower than these numbers by an amount that depends on where you are taxed. Real careers rarely follow a smooth curve: a single promotion or external job move can shift the whole path in one step, and a pay freeze can flatten it.
Interpreting Your Result
Your projected salary is nominal, not inflation-adjusted. The calculator grows the number on your contract; it does not ask what that number will buy. If prices rise while your salary rises, only the difference between the two represents genuinely improved purchasing power.
To approximate real (inflation-adjusted) growth, combine your raise rate \(r\) with an assumed average inflation rate \(i\) over the same period:
$$r_{\text{real}} = \frac{1 + r}{1 + i} - 1$$A quick shortcut, \(r_{\text{real}} \approx r - i\), is accurate enough when both rates are small, but the exact form is better for long horizons or high inflation.
Worked example. Start at 75,000 with a 4% annual raise for 10 years. The nominal result is
$$S_{10} = 75{,}000 \times (1 + 0.04)^{10} = 75{,}000 \times 1.480244 = 111{,}018.32$$so the projected salary is 111,018.32 — a 48.02% nominal gain. Now assume inflation averages 2.5% per year:
$$r_{\text{real}} = \frac{1.04}{1.025} - 1 = 0.014634 = 1.4634\% \text{ per year}$$In today's money the same salary is worth \(111{,}018.32 \div (1.025)^{10} = 111{,}018.32 \div 1.280085 \approx 86{,}727\). So a 48% raise on paper is roughly a 15.6% improvement in purchasing power. Inflation rates vary widely by country and period — use a figure that reflects your own economy, not a global default.
The break-even point. A raise exactly equal to inflation (\(r = i\)) leaves \(r_{\text{real}} = 0\): your pay keeps pace with prices and your standard of living is roughly flat. A raise below inflation is a real-terms pay cut even though the number on your payslip went up. This is why many employers separate a cost-of-living adjustment from a merit increase — only the portion above inflation is genuine advancement. Note that personal inflation can differ from headline inflation, since your spending mix (rent, transport, childcare) may not match the national basket.
What “total earned” does and does not include. The cumulative figure is the sum of gross, pre-tax annual salaries over the projection period. It excludes income tax and social/payroll contributions, bonuses, commission, overtime, equity or profit-sharing, employer pension and insurance contributions, and any other benefits. It also assumes continuous, full-time employment at the stated raise: promotions, demotions, job changes, pay freezes, parental or medical leave, layoffs, and unpaid gaps are all ignored. Treat it as a smooth baseline for comparing scenarios, not as a forecast of lifetime income.
How to use it sensibly. Run several rates rather than one — for instance a pessimistic 2%, a likely 3–4%, and an optimistic 6% — and look at the range instead of a single figure. Compare the value of a one-time raise against a higher ongoing rate: because raises compound, a permanently higher percentage usually outweighs a modest one-off adjustment over long horizons.
This section is general information only and is not professional financial, tax, or career advice. Projections are illustrative and depend entirely on the assumptions you enter. For decisions about your own compensation, taxes, or savings, consult a qualified professional familiar with your situation and jurisdiction.
Income and jobs: United States
Average income and unemployment in United States compared with the world, from the World Bank: a benchmark for the figures you enter above.
- GNI per capita 2025
- 88,810 USD
- GDP per capita, PPP 2025
- 90,027 intl. $
- World: 25,704
- Unemployment 2025
- 4.2%
- World: 4.8%
Latest change Up +7.1% 2025: 88,810 USD, against 82,910 USD in 2024. CalculatorLib computes this change from the two published figures.
In 2025, gross national income per person in United States was 88,810 US dollars a year, about 7,401 US dollars a month. World: 14,244 USD
| Year | GNI per capita (USD) | GDP per capita, PPP (intl. $) | Unemployment |
|---|---|---|---|
| 2025 | 88,810 | 90,027 | 4.2% |
| 2024 | 82,910 | 86,170 | 4.0% |
| 2023 | 79,950 | 82,587 | 3.6% |
| 2022 | 77,230 | 78,009 | 3.7% |
| 2021 | 71,510 | 71,441 | 5.3% |
| 2020 | 64,630 | 64,465 | 8.1% |
| 2019 | 65,840 | 65,228 | 3.7% |
| 2018 | 63,040 | 62,876 | 3.9% |
| 2017 | 58,860 | 60,048 | 4.4% |
| 2016 | 56,830 | 57,977 | 4.9% |
GNI per capita (Atlas method) is the average of all income in the economy, not a typical salary; PPP dollars adjust for local prices.
Income tax and social security: United States
- Top income tax rate 2025
- 43.65%
- from 8.7 × the average wage
- Employee social security 2025
- 7.65% · 1.45%
In 2025, the top statutory personal income tax rate in United States (central and local government combined) was 43.65%. It applies from 8.7 times the average wage of 73,520 USD, that is from about 642,101 USD a year.
Employee social security contribution rates for successive earnings bands, lowest band first; the band limits are not shown.
Top income tax rates in OECD countries
| Country | Top rate | Applies from (× average wage) | Year |
|---|---|---|---|
| Japan | 55.95% | 7.7 | 2025 |
| France | 55.37% | 12.9 | 2025 |
| South Korea | 49.5% | 19.0 | 2025 |
| Germany | 47.48% | 4.4 | 2025 |
| United Kingdom | 45% | 2.2 | 2025 |
| United States | 43.65% | 8.7 | 2025 |
| Türkiye | 40.76% | 5.6 | 2025 |
| Mexico | 35% | 20.6 | 2025 |
The top rate is the statutory rate on the highest earnings, not the rate most workers pay. OECD figures cover OECD member countries only.
United States and other countries
GNI per capita in current US dollars (Atlas method) — each country’s latest published year.
- United States 88,810 USD (2025)
- France 48,630 USD (2025)
- Japan 38,340 USD (2025)
- South Korea 37,880 USD (2025)
- Saudi Arabia 36,070 USD (2025)
- Türkiye 16,300 USD (2025)
- Russia 15,960 USD (2025)
- World 14,244 USD (2025)
- China 14,230 USD (2025)
- Mexico 13,730 USD (2025)
- Vietnam 4,970 USD (2025)
- India 2,760 USD (2025)
No published figure yet for Taiwan.
Years can differ between rows: each figure is shown with its own year. The same World Bank indicator for every country.
Latest figure: 2025 Data last updated 2026-10-18 · current
Source: The World Bank Group CC BY 4.0; OECD, Tax Database CC BY 4.0
Monthly figures are computed by CalculatorLib from these data. The top-rate threshold in national currency (multiple × average wage) is computed by CalculatorLib from these data.
Source details and methodology
- The World Bank Group — World Development Indicators (NY.GNP.PCAP.CD, NY.GDP.PCAP.PP.CD, SL.UEM.TOTL.ZS)
- OECD, Tax Database — Top statutory personal income tax rate; employee social security contribution rates
FAQ
Does it use compound or simple raises? It compounds — each year raise builds on the prior year salary, which is how most real raises work.
What is "total earned over the period"? It sums each year salary from year 1 through year n, giving an estimate of cumulative gross earnings during the projection.
Can I model different raises each year? This tool uses a single average raise rate. For varying raises, run it in segments using the resulting salary as the next starting point.