What the SAT Score Calculator Does
This calculator is built for the United States SAT, using the older three-section format that reports separate Math, Reading, and Writing scores. You enter the three section scores and it instantly returns your total score and the average score per section. It is a quick way to add up your results without doing the arithmetic by hand and to see how balanced your performance is across the three areas.
The Inputs You Enter
- Math Score – your SAT Math result, on the standard 200–800 scale.
- Reading Score – your SAT Reading result, also 200–800.
- Writing Score – your SAT Writing result, again 200–800.
Each section uses the same 200–800 range. If a field is left blank or contains text that isn't a number, the calculator defaults that section to 600. Any value you enter is then clamped: anything below 200 is treated as 200, and anything above 800 is treated as 800. This keeps results inside the valid SAT range even if you mistype.
The Formula
The math behind it is straightforward:
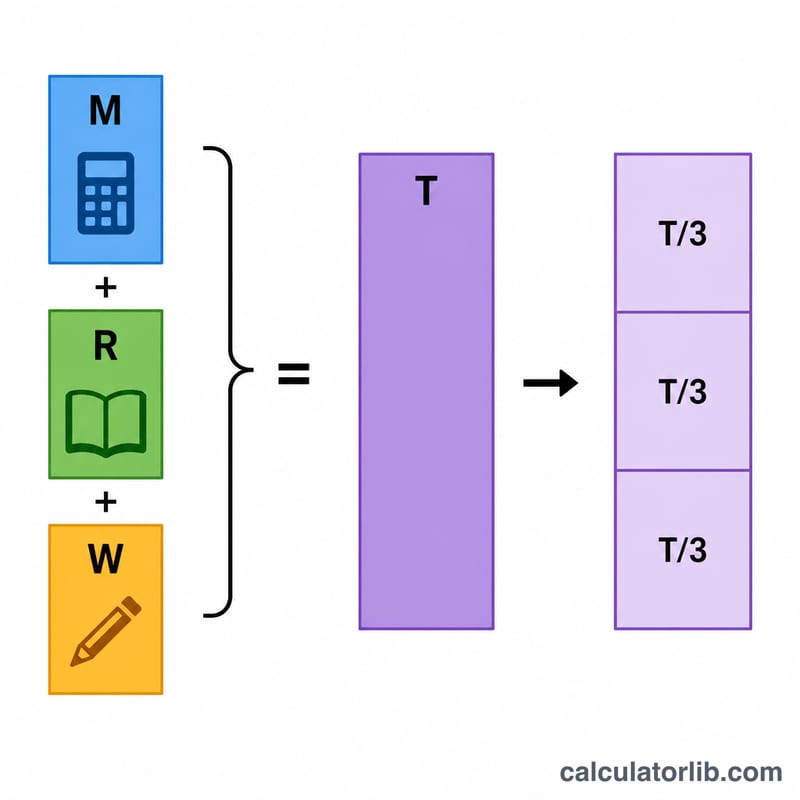
- Total Score = Math + Reading + Writing
- Average Score = Total ÷ 3
Because each section maxes out at 800, the highest possible total across these three sections is 2400, and the lowest possible is 600.
Worked Example
Suppose you scored 700 in Math, 650 in Reading, and 680 in Writing.
- Total = 700 + 650 + 680 = 2030
- Average = 2030 ÷ 3 ≈ 676.7 per section
The average of about 677 tells you your sections are fairly close together, with Reading being your weakest of the three — a useful pointer for where to focus your study time.
Converting Between the 2400 and 1600 SAT Scales
This calculator works with the three-section SAT format used in the United States from 2005 to early 2016: Math, Critical Reading, and Writing, each reported on a 200–800 scale, for a total of 600–2400. The SAT administered by the College Board (a US testing organization) since March 2016 reports two sections — Evidence-Based Reading and Writing (ERW) and Math — for a total of 400–1600. Because the two tests differ in content and scaling, there is no exact one-to-one conversion between them. The College Board, working with ACT, published official concordance tables in 2016 that give statistically derived equivalents; every value below is approximate and should be read as "this old score corresponds to roughly this new score," not as an arithmetic identity.
| Old SAT total (2400 scale) | Approximate current SAT total (1600 scale) |
|---|---|
| 2400 | 1600 |
| 2200 | 1510 |
| 2000 | 1400 |
| 1800 | 1290 |
| 1500 | 1100 |
| 1200 | 900 |
| 600 | 400 |
Notice that the relationship is not proportional. Dividing an old total by 1.5 does not reproduce these figures: 1800 ÷ 1.5 = 1200, but the official concordance places 1800 near 1290. The mapping is compressed at the top (2400 and 1600 are both the maximum) and stretched in the middle, so intermediate totals must be looked up or interpolated between published rows rather than scaled.
Section-level structure
| Old 2400-scale component | Old range | Current 1600-scale counterpart | Current range |
|---|---|---|---|
| Critical Reading + Writing (two separate section scores) | 200–800 each, 400–1600 combined | Evidence-Based Reading and Writing (one section score) | 200–800 |
| Mathematics | 200–800 | Math | 200–800 |
| Total of three sections | 600–2400 | Total of two sections | 400–1600 |
The two old verbal sections were merged into a single ERW score, so the old Reading and Writing pair (a 400–1600 combined range) maps onto one 200–800 section score. Math keeps the same nominal 200–800 range, but an identical number does not mean an identical achievement level, because the content and scaling changed; the College Board published a separate section-level concordance for ERW and for Math for exactly this reason.
Worked example
Suppose an old score report shows Math 600, Critical Reading 620, and Writing 580. Entering those three values gives:
$$\text{Total} = 600 + 620 + 580 = 1800$$So the three-section total is 1800 on the 2400 scale, which the concordance table above places at roughly 1290 on the current 1600 scale. For the verbal side, Critical Reading 620 plus Writing 580 is the pair that the current test reports as a single ERW score; the exact ERW equivalent must be read from the official section concordance rather than averaged by hand. Always cite the original 2400-scale score alongside any converted figure, and label converted values as concordance estimates.
Interpreting Your Total and Section Average
On the three-section SAT, each section is reported from 200 to 800, so the total ranges from 600 to 2400. The scale was designed so that the mean score on each section would sit near 500, which implies a composite near 1500 for the sum of three sections. In practice, published means for US test-taker cohorts on this format clustered a little below and around that design point — typically in the roughly 490–520 range per section — so the midpoint of the distribution was near, but not exactly at, 1500.
| Total (2400 scale) | Position in the distribution |
|---|---|
| 600–1200 | Below the historical mean composite; corresponds to average section scores of about 200–400 |
| 1200–1500 | Approaching the mean; average section scores of about 400–500 |
| Around 1500 | Near the composite of three sections at the design mean of 500 each |
| 1500–1800 | Above the mean; average section scores of about 500–600 |
| 1800–2100 | Upper range; average section scores of about 600–700 |
| 2100–2400 | Top range; average section scores of about 700–800, up to the 800 per-section ceiling |
These bands describe the scale itself and the US cohorts that took this format; they are not percentile ranks. Exact percentiles depend on the specific reference year and reference group printed on the score report.
What the section average actually tells you
The section average is simply the total divided by three:
$$\text{Average} = \frac{\text{Total}}{3}$$For example, Math 720, Reading 540, and Writing 600 give a total of 1860 and an average of
$$\text{Average} = \frac{1860}{3} = \underline{620}$$or 620 points per section. This number is a convenience statistic, not an official SAT score: the College Board never reported a "section average," and nothing on a score report carries that label. Its only real use is as a single reference point on the familiar 200–800 scale, letting you see at a glance which sections sit above and which sit below your own overall level. Because the average is an exact linear function of the total, it carries no information the total does not already contain — two people with the same total always have the same average, however differently their points are distributed.
Reading the gap between sections
What the average hides is spread. In the example above, the highest section (Math 720) exceeds the lowest (Reading 540) by 180 points, so the three scores are 100 above, 20 below, and 80 below the 620 average. A wide gap of this kind indicates uneven performance across the tested skill areas: the sections measure different domains, so a large spread means the strength shown in one domain was not matched in another, and the single total is being carried disproportionately by one section. A narrow gap — say all three sections within 20 or 30 points of each other — indicates balanced performance, where the average is a fair summary of every section. Two totals of 1860 can therefore describe very different profiles, for instance 720/540/600 versus 620/620/620, which is precisely why the spread should be read alongside the average rather than replaced by it.
Historically, US colleges that required the SAT reviewed the reported total and the individual section scores, sometimes combining the best section scores across multiple test dates. They did not use a section average. Treat the average as a personal diagnostic for comparing balance across sections, and quote the official total and section scores whenever a score is being reported to someone else.
Frequently Asked Questions
Why does my score get changed when I enter a number below 200? The SAT scale only goes from 200 to 800 per section, so the calculator clamps out-of-range values to the nearest valid limit to keep your total realistic.
Why does the calculator show 600 if I leave a box empty? 600 is used as a sensible default placeholder so you still get a complete result. For an accurate total, fill in all three of your actual scores.
Does this match the current SAT total of 1600? No. The current SAT combines Reading and Writing into one score for a 1600 total. This tool uses the older three-section model (Math, Reading, Writing) that produces a 2400 maximum, which is handy for older score reports.